Verizon Coverage Map

Stetson Doggett
by
Stetson Doggett
|
Updated:
April 26, 2024

Does Verizon have good coverage?

Use the interactive maps below to check Verizon coverage in your area

You can also download the free Coverage Map app for iPhone and Android to compare cellular coverage between carriers.

Map Key:
Great coverage
Good coverage
Poor coverage
Great coverage = stream 4K videos, video call, use your phone to its fullest potential
Good coverage = stream 480p videos, browse social media, stream music, use the web
Poor coverage = make phone calls, send a text
*The Estimated Coverage Map is created with coverage data from the FCC

Verizon Cell Phone Plans

Verizon Unlimited Welcome
Verizon coverage
1 Line
$
65
/mo
+tax
tax included
500GB
high-speed, then 4Mbps
Deprioritized
No hotspot
480p SD video streaming
Unlimited minutes
Unlimited texts
Verizon Unlimited Plus
Verizon coverage
1 Line
$
80
/mo
+tax
tax included
Unlimited
high-speed
Unlimited priority
30GB hotspot
720p HD video streaming
Unlimited minutes
Unlimited texts
Verizon Unlimited Ultimate
Verizon coverage
1 Line
$
90
/mo
+tax
tax included
Unlimited
high-speed
Unlimited priority
60GB hotspot
1080p HD video streaming
Unlimited minutes
Unlimited texts
Visible Base
Verizon coverage
1 Line
$
20
/mo
+tax
tax included
Unlimited
high-speed
Deprioritized
5Mbps hotspot
480p SD video streaming
Unlimited minutes
Unlimited texts
US Mobile Unlimited Starter
T-Mobile or Verizon coverage
1 Line
$
29
/mo
+tax
tax included
35GB
high-speed, then 1Mbps
35GB priority
10GB hotspot
720p HD video streaming
Unlimited minutes
Unlimited texts
Visible+
Verizon coverage
1 Line
$
35
/mo
+tax
tax included
Unlimited
high-speed
50GB Premium
5Mbps hotspot
480p SD video streaming
Unlimited minutes
Unlimited texts

Verizon Coverage

Fast facts about Verizon coverage in the continental U.S.:

  • #2 most coverage overall
  • Total area covered: 71.5%
  • Total square miles covered: 5,775,641
  • 5G area covered: 14.7%
  • 5G square miles covered: 1,191,703

According to cellular signal strength data from the FCC, Verizon currently has the second largest overall network in the United States.

Its network covers 71.5% of the total land area in the continental U.S., which is about 5.78 million square miles.

Verizon's 5G network, meanwhile, is the third largest. It covers just 14.7% of the continental U.S. and provides about 1.19 million square miles of 5G coverage.

Despite having a small footprint, Verizon says its fast 5G Ultra Wideband network reaches over 222 million Americans.

Over 99% of Americans will get coverage on Verizon's LTE network.

That said, cellular coverage varies a LOT by location. You may be wondering, "how good is Verizon's coverage where I live?"

To find out how good Verizon's coverage is in your area, use our interactive map at the top of this page.

You can also download our free Coverage Map app for iPhone and Android.

Get the Free Coverage Map App

Measure your cellular data speeds. Compare cellular coverage. Completely free.

Download Coverage Map app on the Apple App StoreGoogle Play Store badge
iPhone with Coverage Map app on screen showing download and upload speeds in an area in New York, NY

What network does Verizon use?

Verizon uses their own nationwide 4G LTE and 5G networks to provide coverage.

Verizon 5G Coverage

Verizon 5G coverage map

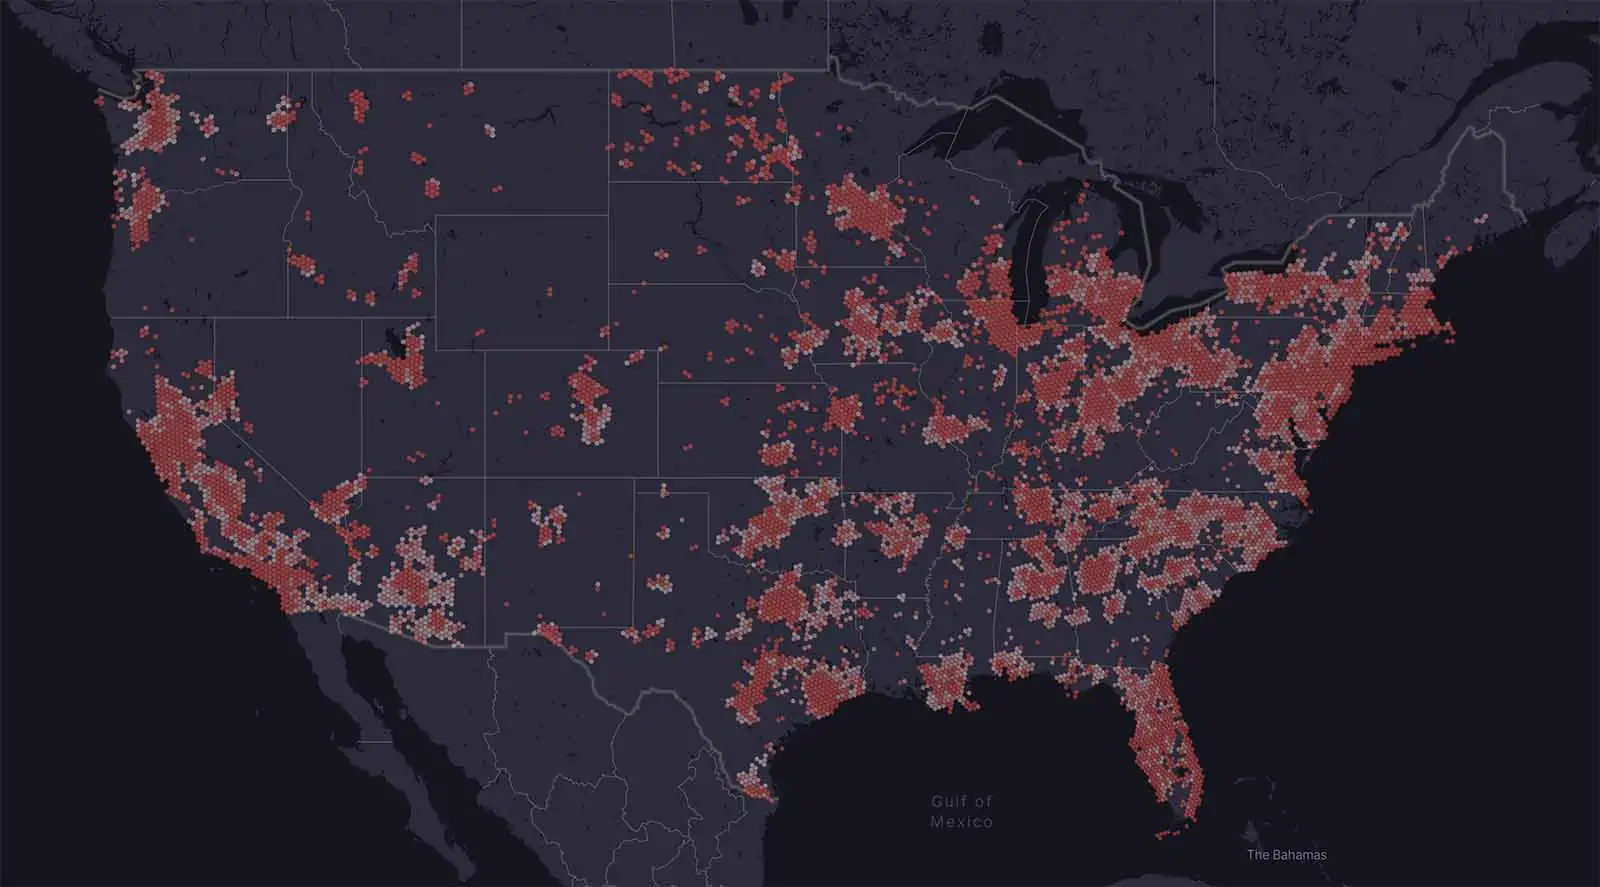
According to FCC data, Verizon is behind when it comes to 5G.

Verizon 5G only covers 14.7% of the U.S., which is less than T-Mobile (49.0%) and AT&T (41.4%).

Still, you don’t need to cover a lot of land area to cover a lot of people.

Verizon says its fast 5G Ultra Wideband network covers 222 million people, or around 60% of the U.S. population. And Verizon’s more extensive Nationwide 5G network covers over 230 million people, or just over 69% of the U.S. population.

Verizon is continuing to build out its 5G network, so you can expect its coverage footprint to continue expanding.

If you haven’t tried Verizon’s network in a while, it may be worth taking advantage of Verizon’s 30 day free trial

Verizon LTE Coverage

Verizon LTE coverage map

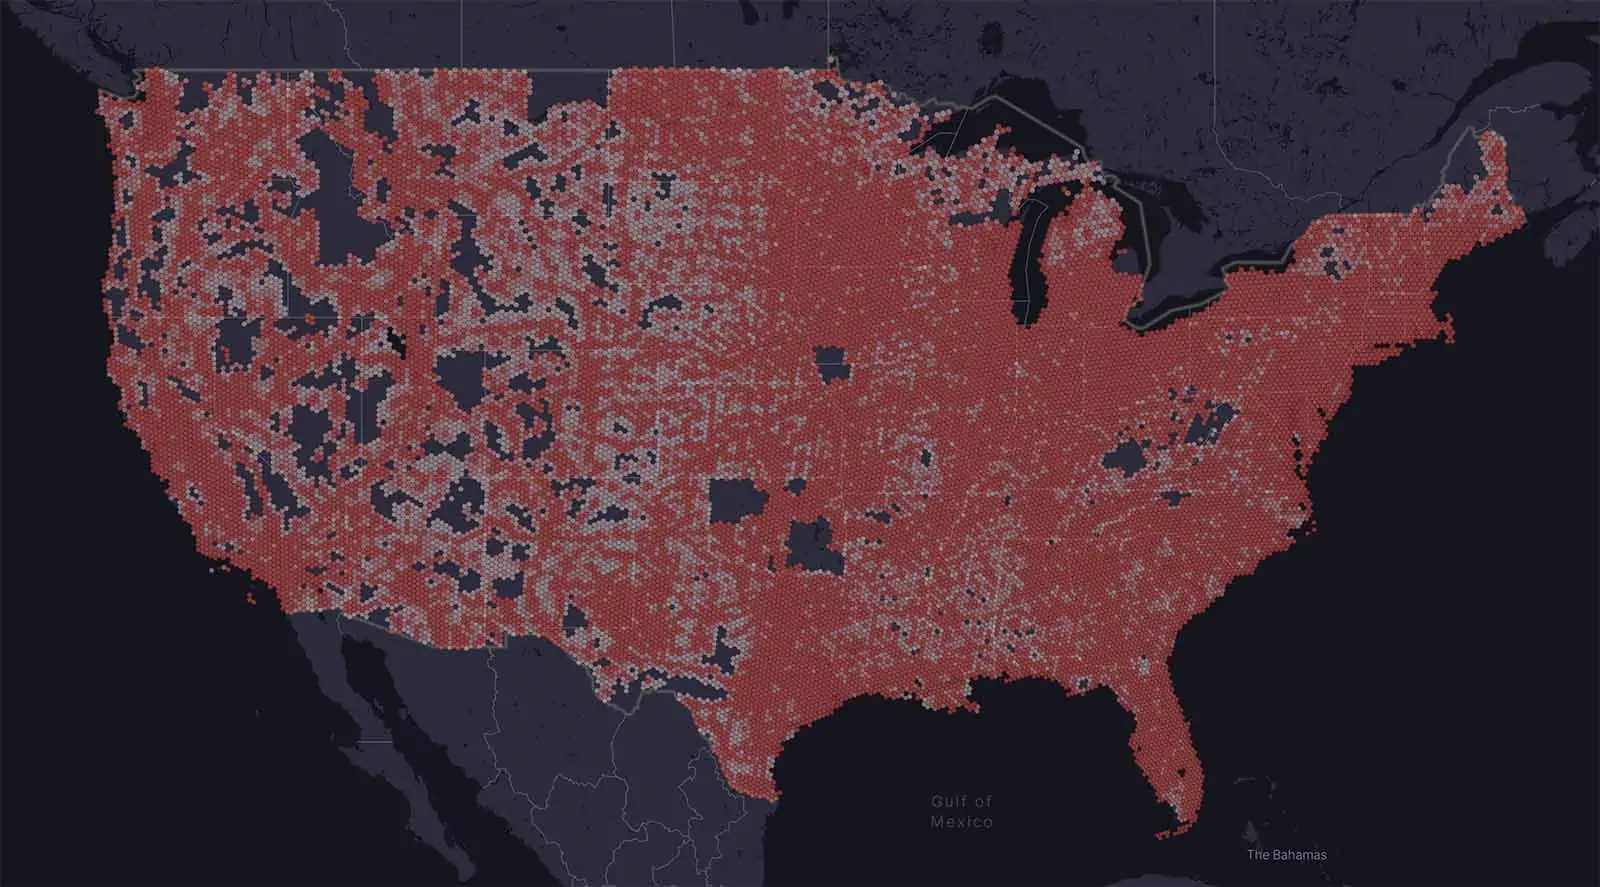
Verizon’s LTE network is nationwide and covers over 98% of the US population.

Verizon Coverage by State

Verizon's network covers an impressive 71.5% of the United States.

But how good is Verizon's coverage in each individual state?

Here is a detailed breakdown on how good Verizon's coverage is in each state. You will see the total percentage of each state the Verizon network covers, as well as a breakdown of great, good, and poor coverage:

State Total Coverage Great Coverage Good Coverage Poor Coverage
Alabama 87.7% 28.4% 31.7% 27.6%
Alaska 3.8% 0.6% 1.1% 2.1%
Arizona 61.8% 15.9% 19.4% 26.4%
Arkansas 82.6% 30.1% 27.9% 24.7%
California 69.1% 30.7% 22.4% 16.0%
Colorado 63.3% 16.2% 21.9% 25.2%
Connecticut 96.8% 48.9% 34.8% 13.1%
Delaware 98.9% 65.5% 25.9% 7.5%
District of Columbia 100.0% 96.6% 3.4% 0.0%
Florida 93.6% 50.2% 29.2% 14.1%
Georgia 95.4% 33.1% 37.7% 24.5%
Hawaii 72.0% 25.7% 21.9% 24.4%
Idaho 47.2% 17.3% 16.8% 13.1%
Illinois 98.2% 48.7% 35.3% 14.3%
Indiana 98.7% 49.1% 33.4% 16.2%
Iowa 92.4% 42.2% 34.1% 16.0%
Kansas 97.0% 33.0% 32.8% 31.2%
Kentucky 75.3% 26.9% 23.4% 25.1%
Louisiana 88.1% 30.1% 32.0% 25.9%
Maine 70.2% 20.0% 27.1% 23.0%
Maryland 92.7% 53.4% 27.9% 11.5%
Massachusetts 94.9% 48.4% 31.9% 14.6%
Michigan 77.8% 30.1% 24.7% 23.0%
Minnesota 84.8% 36.6% 30.5% 17.7%
Mississippi 83.3% 22.0% 28.5% 32.8%
Missouri 87.5% 29.1% 28.8% 29.6%
Montana 53.5% 14.2% 19.7% 19.5%
Nebraska 85.0% 23.0% 26.5% 35.5%
Nevada 46.9% 16.5% 18.2% 12.2%
New Hampshire 82.6% 26.0% 33.9% 22.7%
New Jersey 98.9% 66.5% 22.4% 10.0%
New Mexico 68.3% 20.5% 24.1% 23.6%
New York 83.7% 33.6% 27.7% 22.4%
North Carolina 88.1% 34.9% 32.0% 21.2%
North Dakota 93.0% 37.6% 35.2% 20.2%
Ohio 93.7% 62.7% 20.5% 10.5%
Oklahoma 55.7% 25.0% 18.4% 12.3%
Oregon 52.6% 14.8% 18.2% 19.6%
Pennsylvania 87.6% 38.4% 26.9% 22.3%
Rhode Island 98.8% 53.5% 30.3% 15.0%
South Carolina 95.0% 35.7% 33.9% 25.4%
South Dakota 86.6% 25.6% 28.8% 32.2%
Tennessee 84.9% 32.2% 27.1% 25.5%
Texas 84.6% 34.9% 29.0% 20.7%
Utah 49.0% 14.2% 17.2% 17.6%
Vermont 75.9% 22.7% 28.5% 24.6%
Virginia 89.7% 32.3% 30.8% 26.6%
Washington 64.7% 22.0% 21.3% 21.4%
West Virginia 45.2% 14.1% 14.5% 16.7%
Wisconsin 77.2% 28.1% 25.2% 23.8%
Wyoming 59.7% 12.4% 21.1% 26.2%

Verizon 5G Coverage by State

State Total 5G Coverage Great 5G Coverage Good 5G Coverage Poor 5G Coverage
Alabama 27.9% 6.0% 8.4% 13.4%
Arizona 19.0% 4.9% 4.4% 9.8%
Arkansas 14.6% 3.0% 4.4% 7.2%
California 33.0% 12.1% 9.5% 11.4%
Colorado 5.9% 2.1% 1.9% 1.9%
Connecticut 40.7% 12.8% 13.8% 14.1%
Delaware 87.0% 29.2% 26.9% 30.9%
District of Columbia 100.0% 71.5% 25.1% 3.4%
Florida 45.7% 15.1% 12.3% 18.3%
Georgia 19.5% 4.8% 5.9% 8.8%
Hawaii 15.6% 3.9% 5.9% 5.8%
Idaho 3.4% 1.5% 1.3% 0.6%
Illinois 20.1% 10.2% 5.4% 4.5%
Indiana 31.8% 12.7% 9.1% 10.0%
Iowa 19.8% 4.7% 6.1% 8.9%
Kansas 7.0% 2.9% 2.3% 1.7%
Kentucky 14.3% 3.9% 4.0% 6.4%
Louisiana 18.8% 5.1% 5.8% 7.9%
Maine 2.1% 0.4% 0.5% 1.2%
Maryland 58.0% 14.4% 15.9% 27.7%
Massachusetts 45.8% 14.4% 15.7% 15.8%
Michigan 23.0% 7.7% 7.1% 8.2%
Minnesota 13.4% 5.3% 4.6% 3.5%
Mississippi 4.0% 0.6% 1.2% 2.2%
Missouri 9.0% 3.0% 2.9% 3.1%
Montana 1.6% 0.8% 0.6% 0.2%
Nebraska 3.1% 1.3% 0.8% 1.1%
Nevada 5.6% 2.4% 1.5% 1.7%
New Hampshire 7.8% 1.2% 2.0% 4.5%
New Jersey 74.5% 31.8% 20.5% 22.2%
New Mexico 2.6% 0.7% 0.6% 1.2%
New York 35.8% 10.2% 10.8% 14.8%
North Carolina 38.9% 8.4% 10.8% 19.7%
North Dakota 9.9% 4.3% 4.0% 1.6%
Ohio 55.3% 17.7% 15.6% 22.0%
Oklahoma 21.9% 5.3% 6.1% 10.5%
Oregon 4.4% 1.5% 1.4% 1.5%
Pennsylvania 40.2% 13.3% 11.3% 15.6%
Rhode Island 59.3% 21.2% 21.3% 16.7%
South Carolina 39.8% 9.6% 10.8% 19.4%
South Dakota 2.7% 1.1% 0.9% 0.8%
Tennessee 29.6% 8.2% 7.9% 13.5%
Texas 15.5% 5.6% 4.0% 5.9%
Utah 6.3% 3.3% 1.7% 1.3%
Vermont 13.3% 1.8% 3.8% 7.7%
Virginia 19.2% 4.6% 5.3% 9.3%
Washington 12.2% 3.2% 3.2% 5.9%
West Virginia 1.9% 0.3% 0.5% 1.1%
Wisconsin 9.6% 3.5% 3.0% 3.1%
Wyoming 0.3% 0.1% 0.1% 0.0%
Wyoming 59.7% 12.4% 21.1% 26.2%

Verizon Data Speeds by State

An important part of how good a cellular network is is how fast the network is.

How fast is Verizon's network?

We compiled our crowd-sourced speed test data to find out. In the case of Verizon, its median download speeds ranged from 11.1 Mbps in Alaska and up to 135.3 Mbps in Washington, DC. Median upload speeds on Verizon ranged from 6.6 Mbps in Mississippi to 24.6 Mbps in Rhode Island. And median ping performance on Verizon ranged from 26 ms to 128 ms.

State Verizon Median Download Speeds Verizon Median Upload Speeds Verizon Median Latency
Alabama 47.4 Mbps 7.6 Mbps 53 ms
Alaska 11.1 Mbps 8.4 Mbps 81 ms
Arizona 77.9 Mbps 12.2 Mbps 40 ms
Arkansas 41.6 Mbps 8.3 Mbps 46 ms
California 63.0 Mbps 11.8 Mbps 40 ms
Colorado 58.1 Mbps 11.1 Mbps 39 ms
Connecticut 82.2 Mbps 11.0 Mbps 43 ms
Delaware 59.1 Mbps 10.2 Mbps 36 ms
District of Columbia 135.3 Mbps 16.3 Mbps 29 ms
Florida 96.6 Mbps 12.9 Mbps 37 ms
Georgia 70.9 Mbps 9.6 Mbps 33 ms
Hawaii 31.8 Mbps 14.1 Mbps 128 ms
Idaho 26.1 Mbps 9.5 Mbps 63 ms
Illinois 103.0 Mbps 14.1 Mbps 31 ms
Indiana 100.9 Mbps 13.5 Mbps 33 ms
Iowa 42.6 Mbps 12.6 Mbps 44 ms
Kansas 53.8 Mbps 11.8 Mbps 49 ms
Kentucky 87.9 Mbps 11.9 Mbps 54 ms
Louisiana 38.3 Mbps 9.1 Mbps 58 ms
Maine 25.0 Mbps 8.3 Mbps 61 ms
Maryland 40.8 Mbps 9.2 Mbps 38 ms
Massachusetts 80.8 Mbps 12.5 Mbps 40 ms
Michigan 71.1 Mbps 9.1 Mbps 40 ms
Minnesota 84.0 Mbps 10.0 Mbps 43 ms
Mississippi 21.5 Mbps 6.6 Mbps 76 ms
Missouri 45.7 Mbps 9.9 Mbps 48 ms
Montana 37.7 Mbps 11.7 Mbps 76 ms
Nebraska 125.2 Mbps 24.1 Mbps 26 ms
Nevada 116.9 Mbps 17.6 Mbps 30 ms
New Hampshire 24.6 Mbps 9.3 Mbps 52 ms
New Jersey 63.7 Mbps 9.7 Mbps 37 ms
New Mexico 38.7 Mbps 9.5 Mbps 74 ms
New York 85.3 Mbps 13.0 Mbps 40 ms
North Carolina 61.8 Mbps 11.0 Mbps 43 ms
North Dakota 94.8 Mbps 14.0 Mbps 46 ms
Ohio 59.0 Mbps 12.7 Mbps 41 ms
Oklahoma 37.2 Mbps 10.2 Mbps 39 ms
Oregon 37.3 Mbps 7.5 Mbps 40 ms
Pennsylvania 78.2 Mbps 10.8 Mbps 37 ms
Rhode Island 114.1 Mbps 24.6 Mbps 36 ms
South Carolina 64.6 Mbps 11.3 Mbps 41 ms
South Dakota 51.6 Mbps 10.3 Mbps 49 ms
Tennessee 58.0 Mbps 10.3 Mbps 44 ms
Texas 62.4 Mbps 9.5 Mbps 35 ms
Utah 47.3 Mbps 11.6 Mbps 55 ms
Vermont 20.0 Mbps 7.8 Mbps 55 ms
Virginia 32.6 Mbps 9.3 Mbps 40 ms
Washington 59.5 Mbps 9.3 Mbps 34 ms
West Virginia 47.1 Mbps 12.9 Mbps 94 ms
Wisconsin 63.7 Mbps 9.3 Mbps 40 ms
Wyoming 13.9 Mbps 9.3 Mbps 79 ms

Verizon vs. AT&T Coverage

Verizon’s coverage is similar to AT&T’s coverage.

According to FCC data, Verizon covers 71.5% of the land area in the U.S. while AT&T covers 74.6%.

You may get a bit less coverage on Verizon in a few locations, but in general the two networks are very similar:

5G coverage is a different story though. Verizon has much worse 5G coverage than AT&T does. Verizon only covers 14.7% of the U.S. with 5G.

AT&T?

It blankets an impressive 41.4% of the country in 5G.

Data speeds on Verizon and AT&T are about the same.

According to data from our crowd sourced speed test map, Verizon's median download speeds are 61.23 Mbps and its median upload speeds are 11.65 Mbps.

AT&T's median download speeds are 61.17 Mbps and its median upload speeds are 11.29 Mbps, which is extremely similar to the performance on Verizon.

Both carriers will likely provide excellent coverage in and out of cities.

To figure out the best carrier in your area, you may want to try the check coverage tool and enter your ZIP code.

You can also check the AT&T coverage map to see what cell reception and data speeds on AT&T look like in your area.

Verizon vs. T-Mobile Coverage

Verizon coverage is better than T-Mobile coverage.

Verizon covers more of the United States than T-Mobile, with 71.5% total coverage compared to T-Mobile’s 59.5% total coverage.

However, Verizon has under one third as much 5G coverage as T-Mobile does. Just 14.7% of area is covered by Verizon 5G, compared to 49.0% covered by T-Mobile 5G.

Verizon is also slower than T-Mobile.

According to our crowd-sourced speed test map, Verizon's median performance is 61.23 Mbps for download and 11.65 Mbps for upload.

T-Mobile gets over 2.4x faster download speeds. Its median download speeds are 152.34 Mbps. T-Mobile's median upload speeds are 17.34 Mbps.

Both Verizon and T-Mobile will likely perform well in cities, with T-Mobile delivering faster speeds.

When it comes to getting service in rural areas though, Verizon’s greater coverage footprint may make it a better option. 

Check our T-Mobile coverage map to see what reception and data speeds on T-Mobile look like in your specific area.

Verizon Coverage Frequently Asked Questions

Is Verizon coverage good?

Verizon has the largest coverage area of any cellular network and covers over 99% of Americans. For most people, Verizon will have good coverage.

Does Verizon offer 5G?

Yes. Verizon offers Nationwide 5G and Ultra Wideband 5G. Nationwide 5G covers more people, and Ultra Wideband 5G delivers super fast data speeds.

Does Verizon have coverage in Canada?

Yes. All of Verizon's postpaid plans include unlimited talk, text, and 2GB of high-speed data per day in Canada.

Does Verizon have coverage in Mexico?

Yes. All of Verizon's postpaid plans include unlimited talk, text, and 2GB of high-speed data in Mexico.

Does Verizon have international coverage?

Verizon charges $10 per day for international service for most of their plans. The international add-on is called the TravelPass, and it includes unlimited talk, text, and 2GB of high-speed data per 24-hour period in the country you're visiting.

Follow us on: