Speed Test Map

A crowdsourced map of cellular performance data.

What is the Speed Test Map?
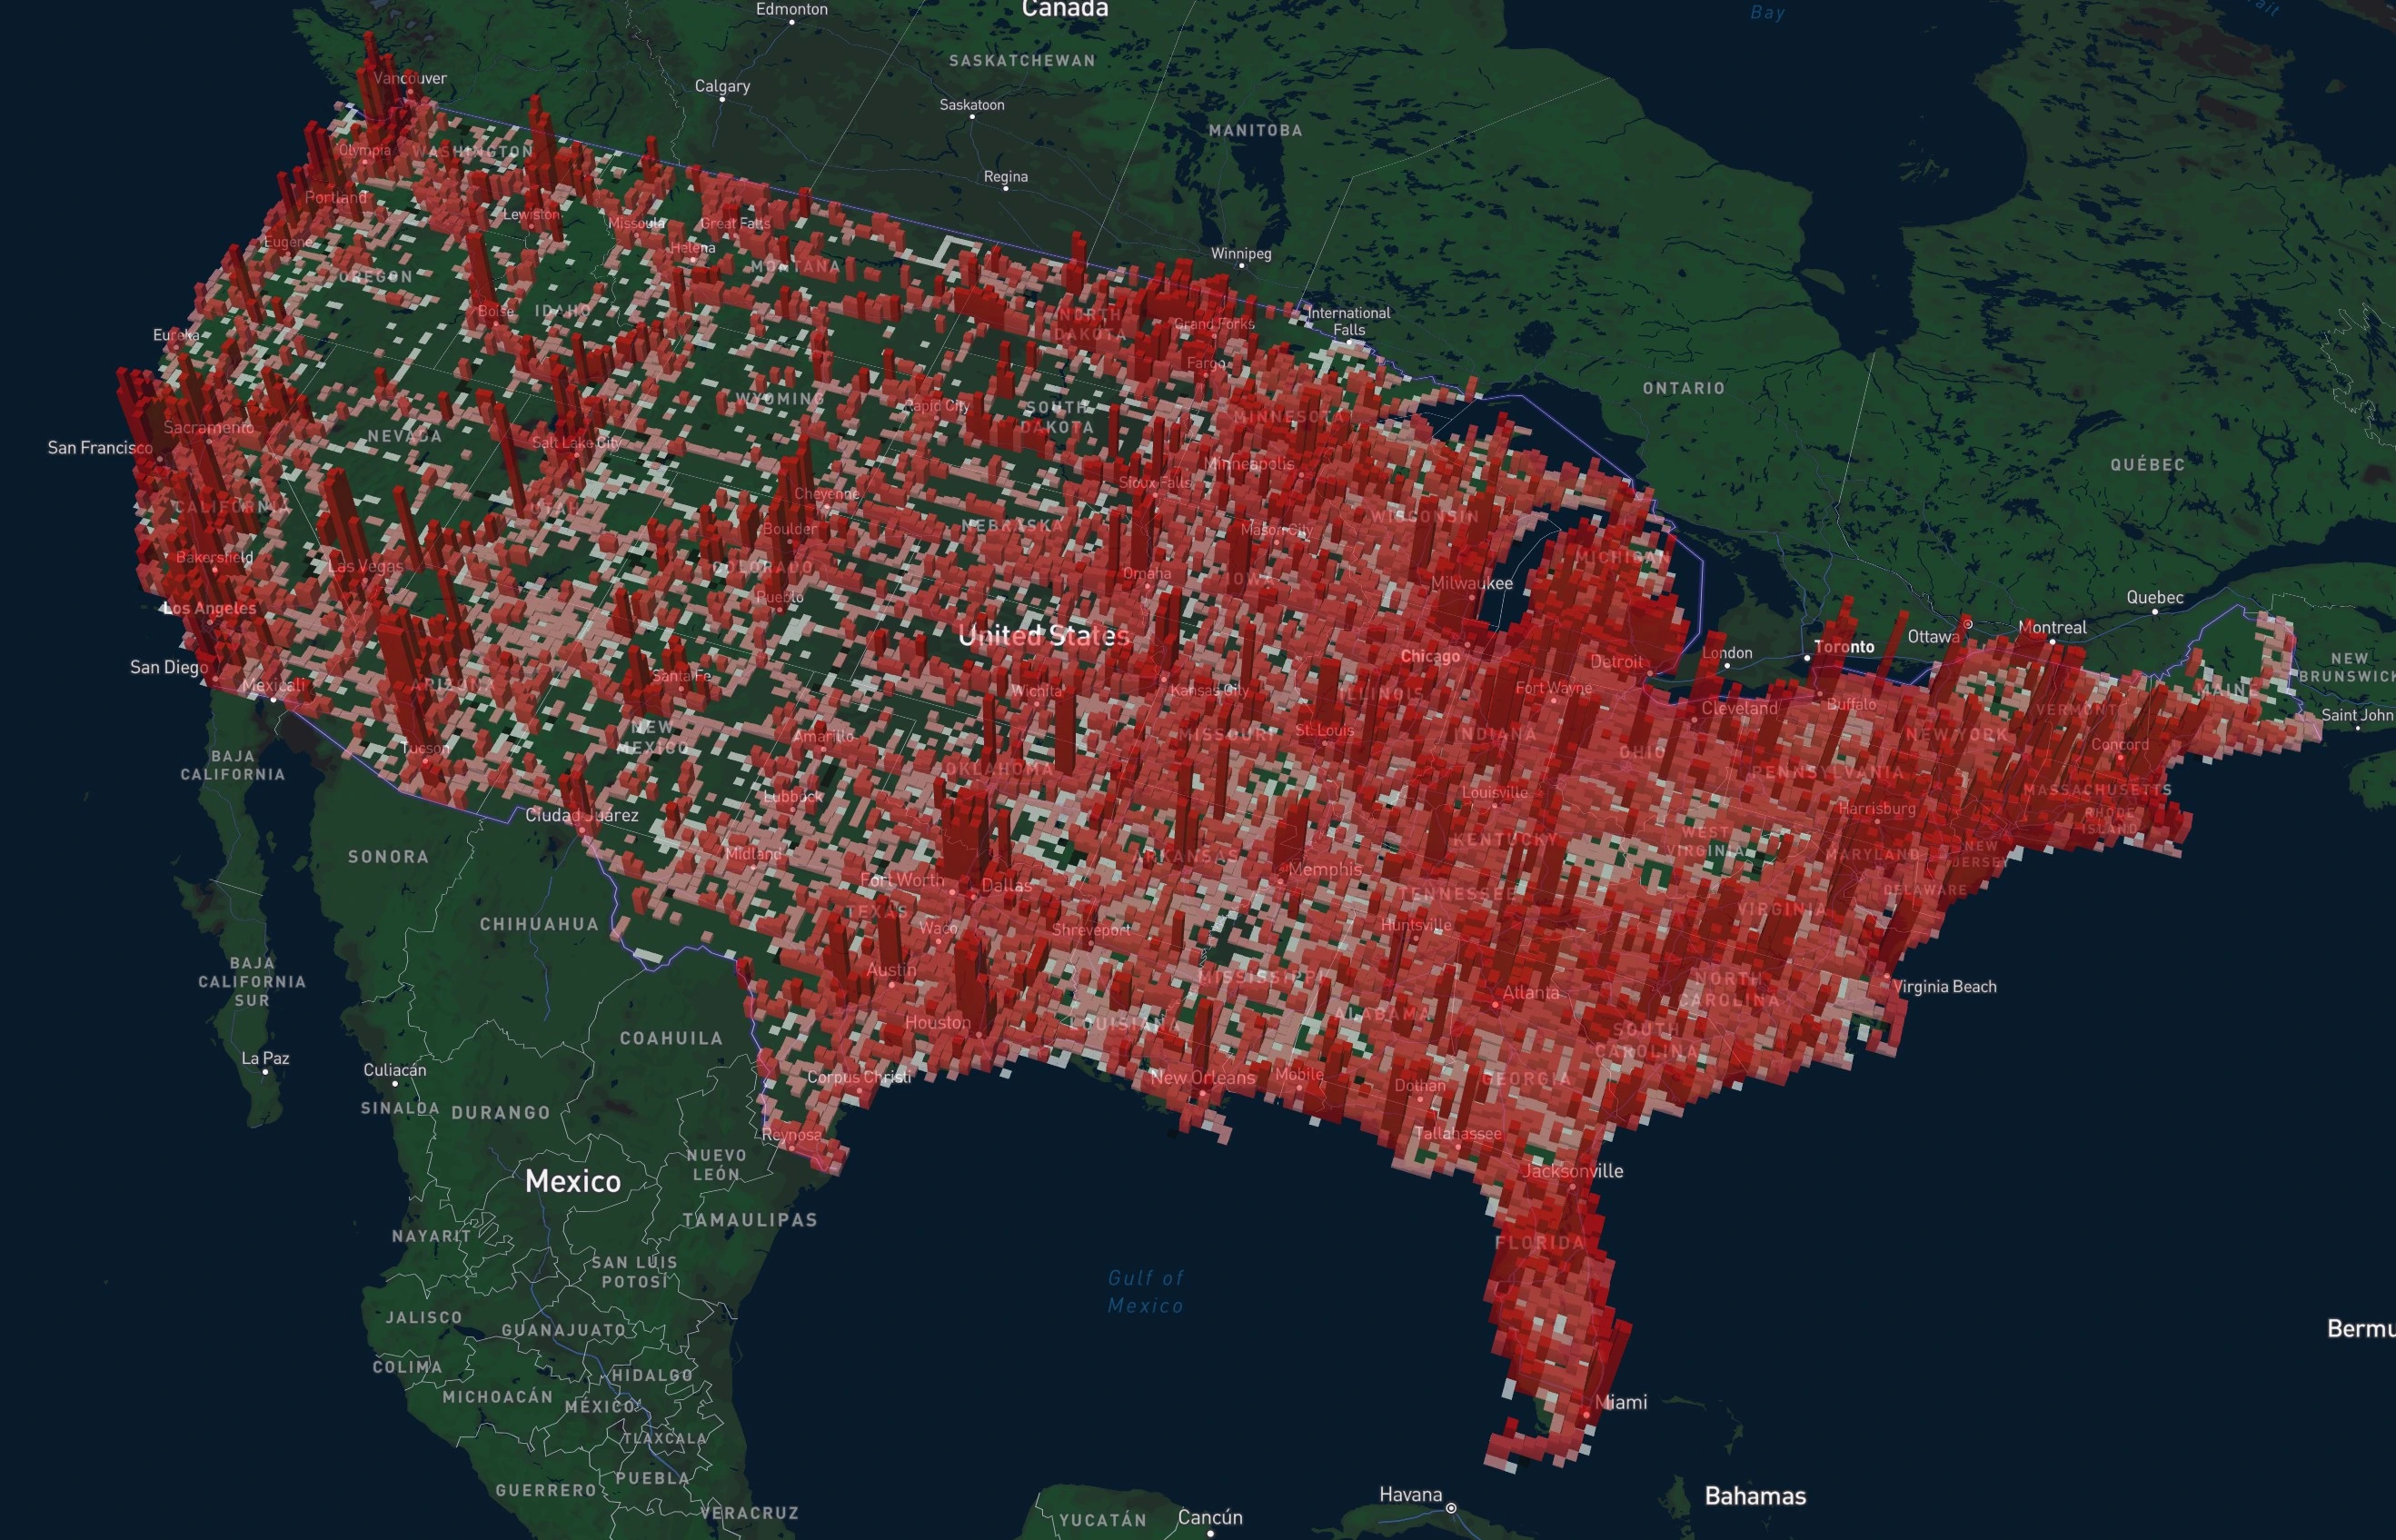
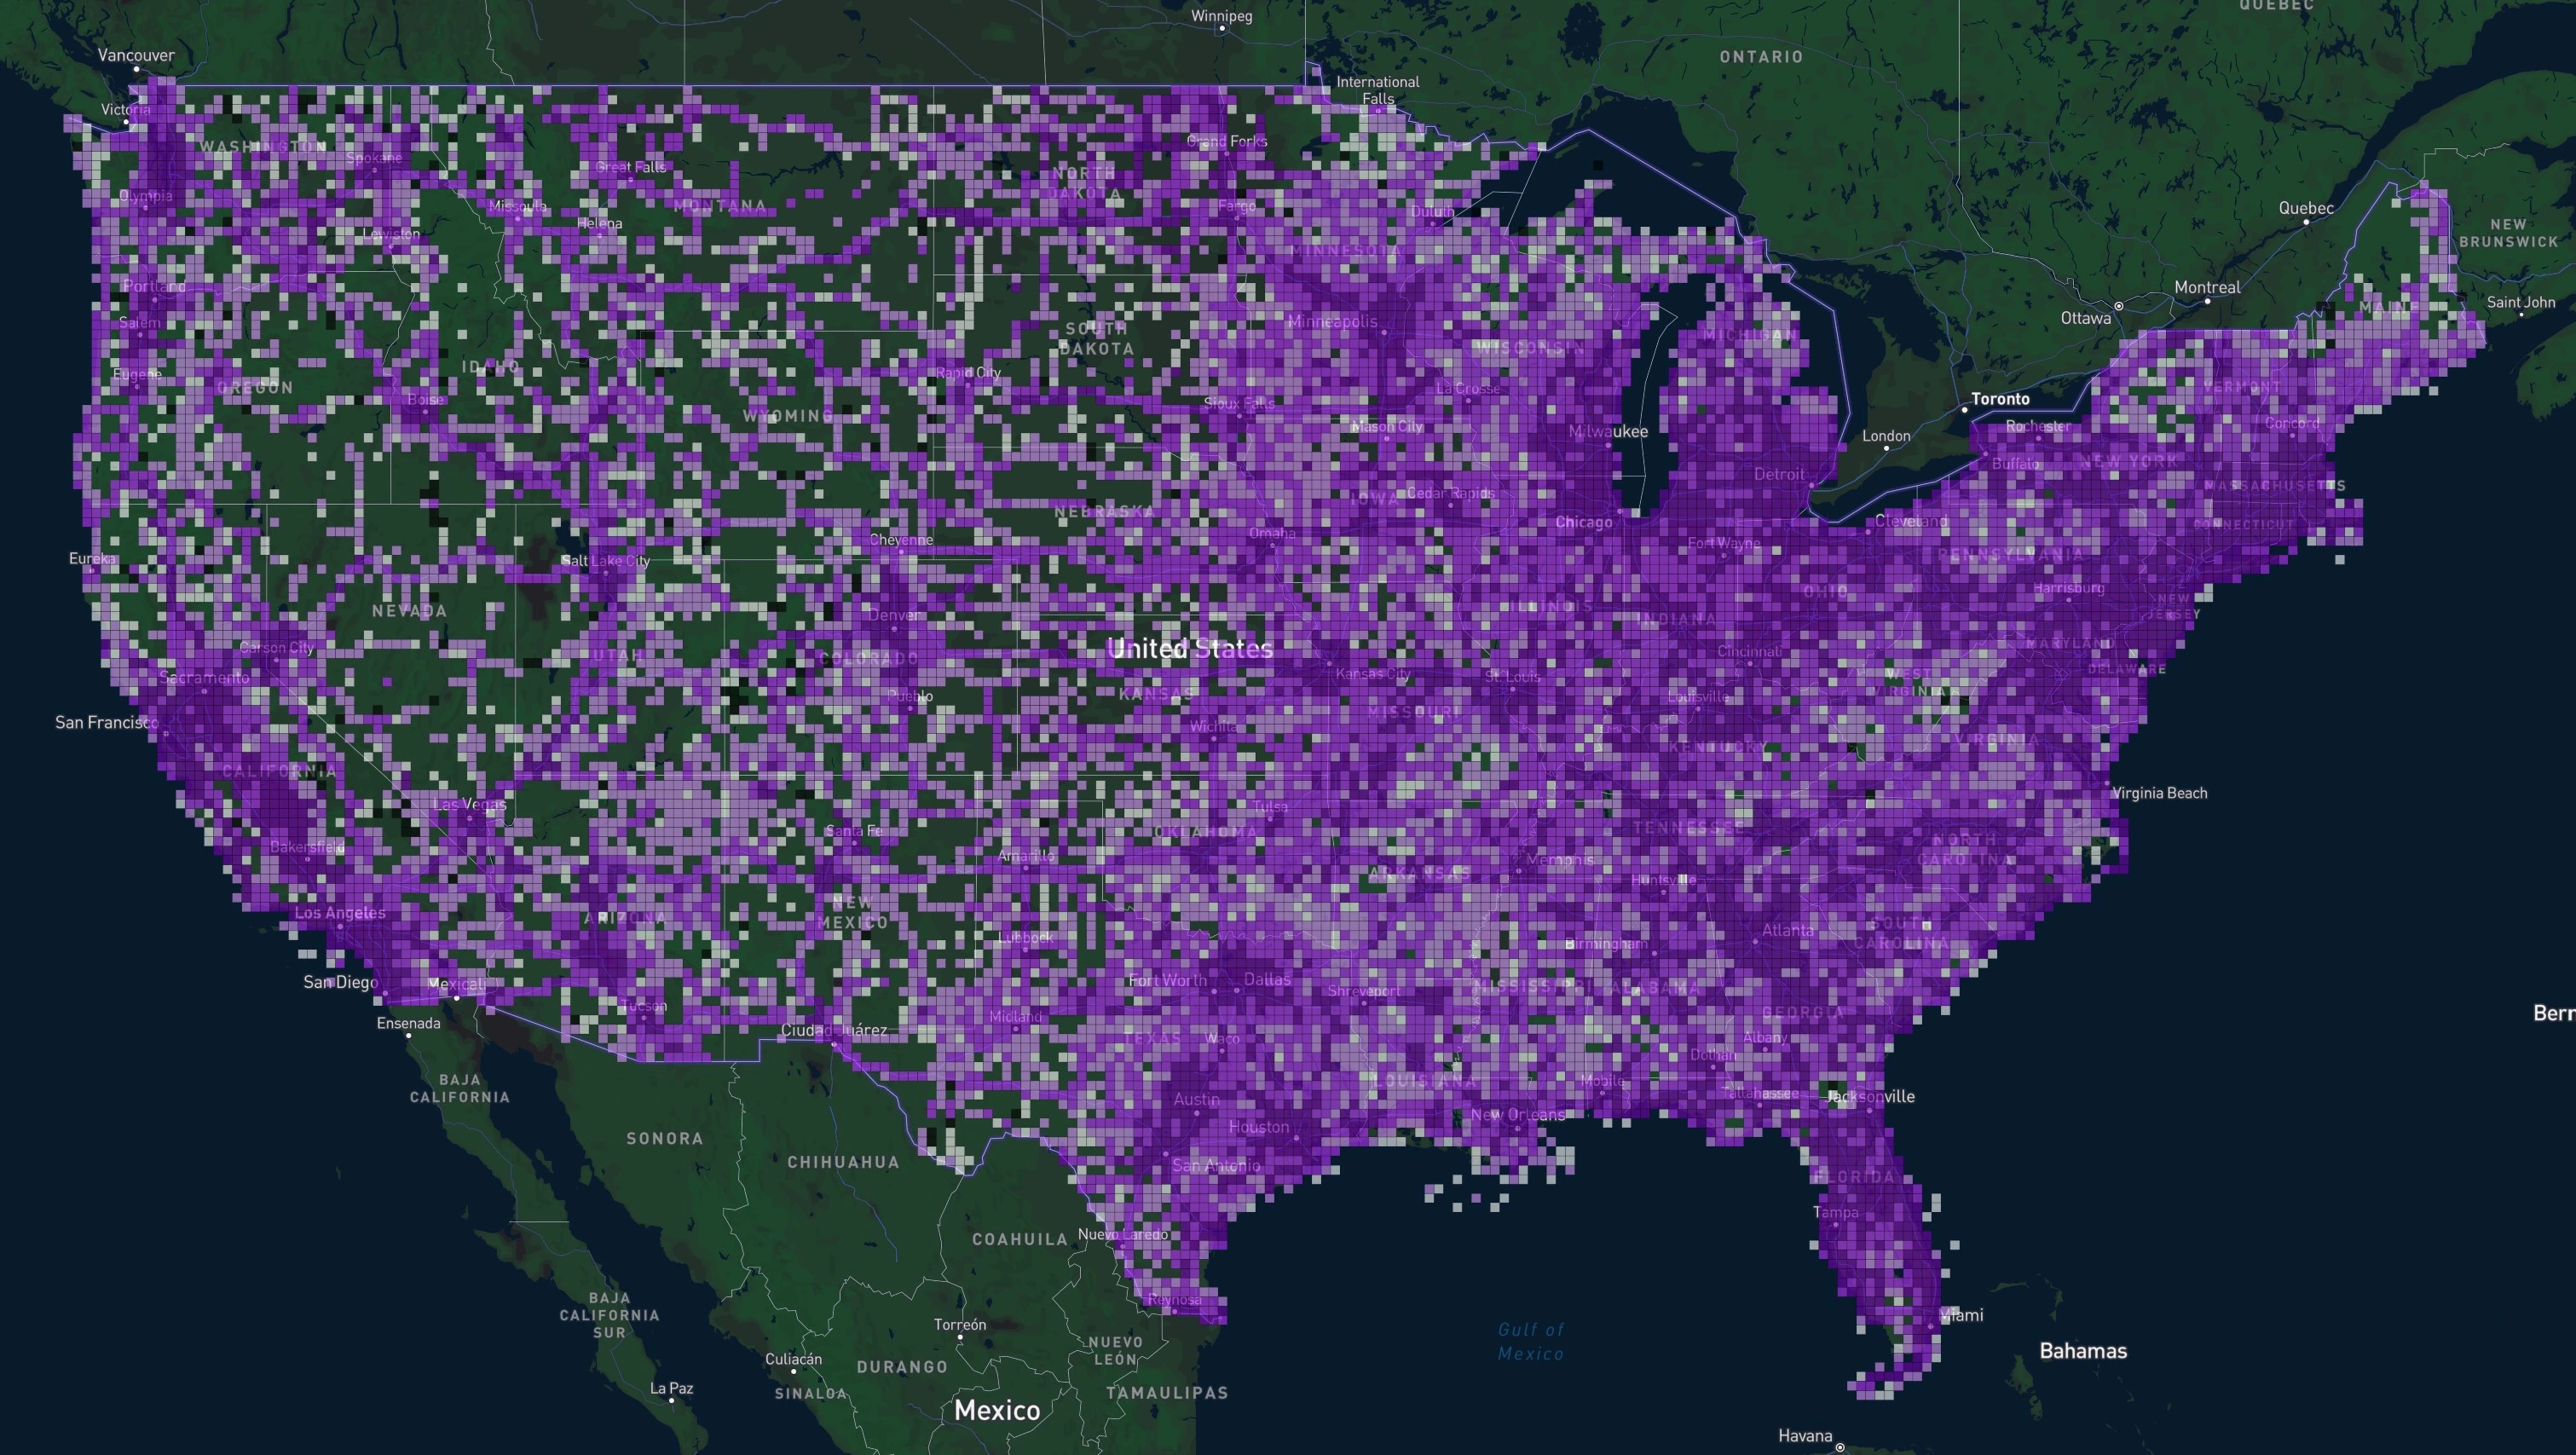
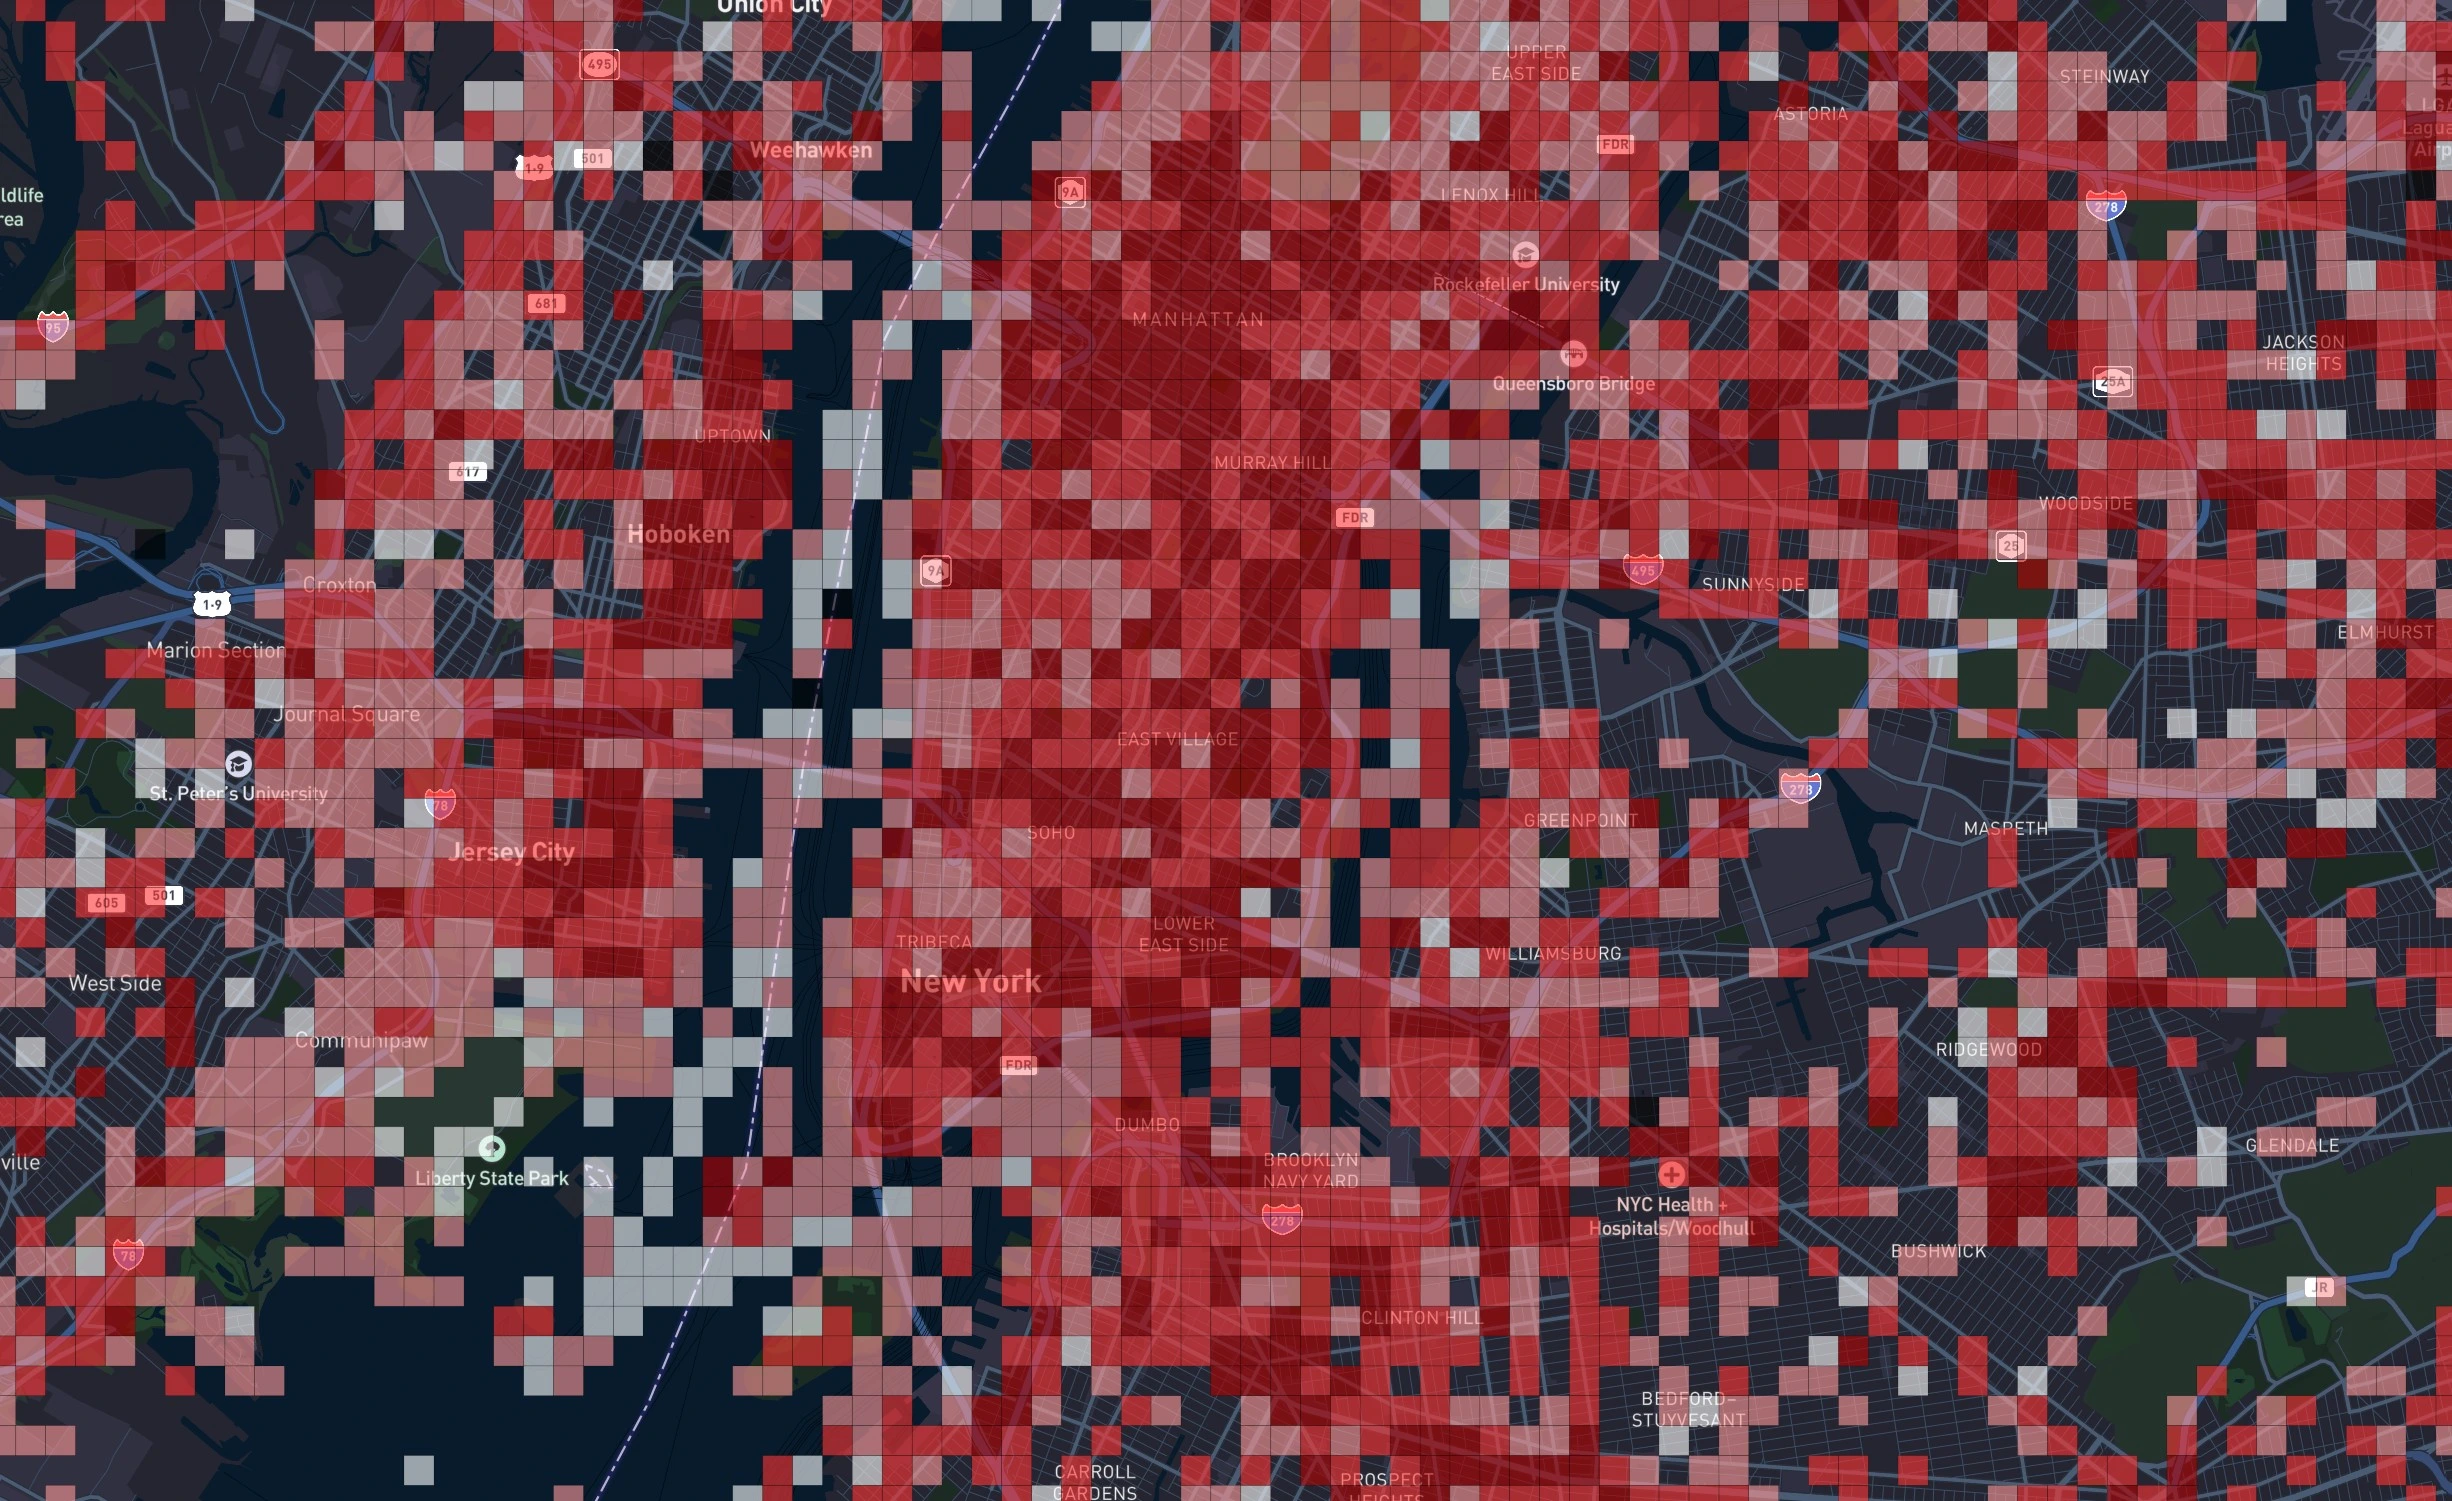
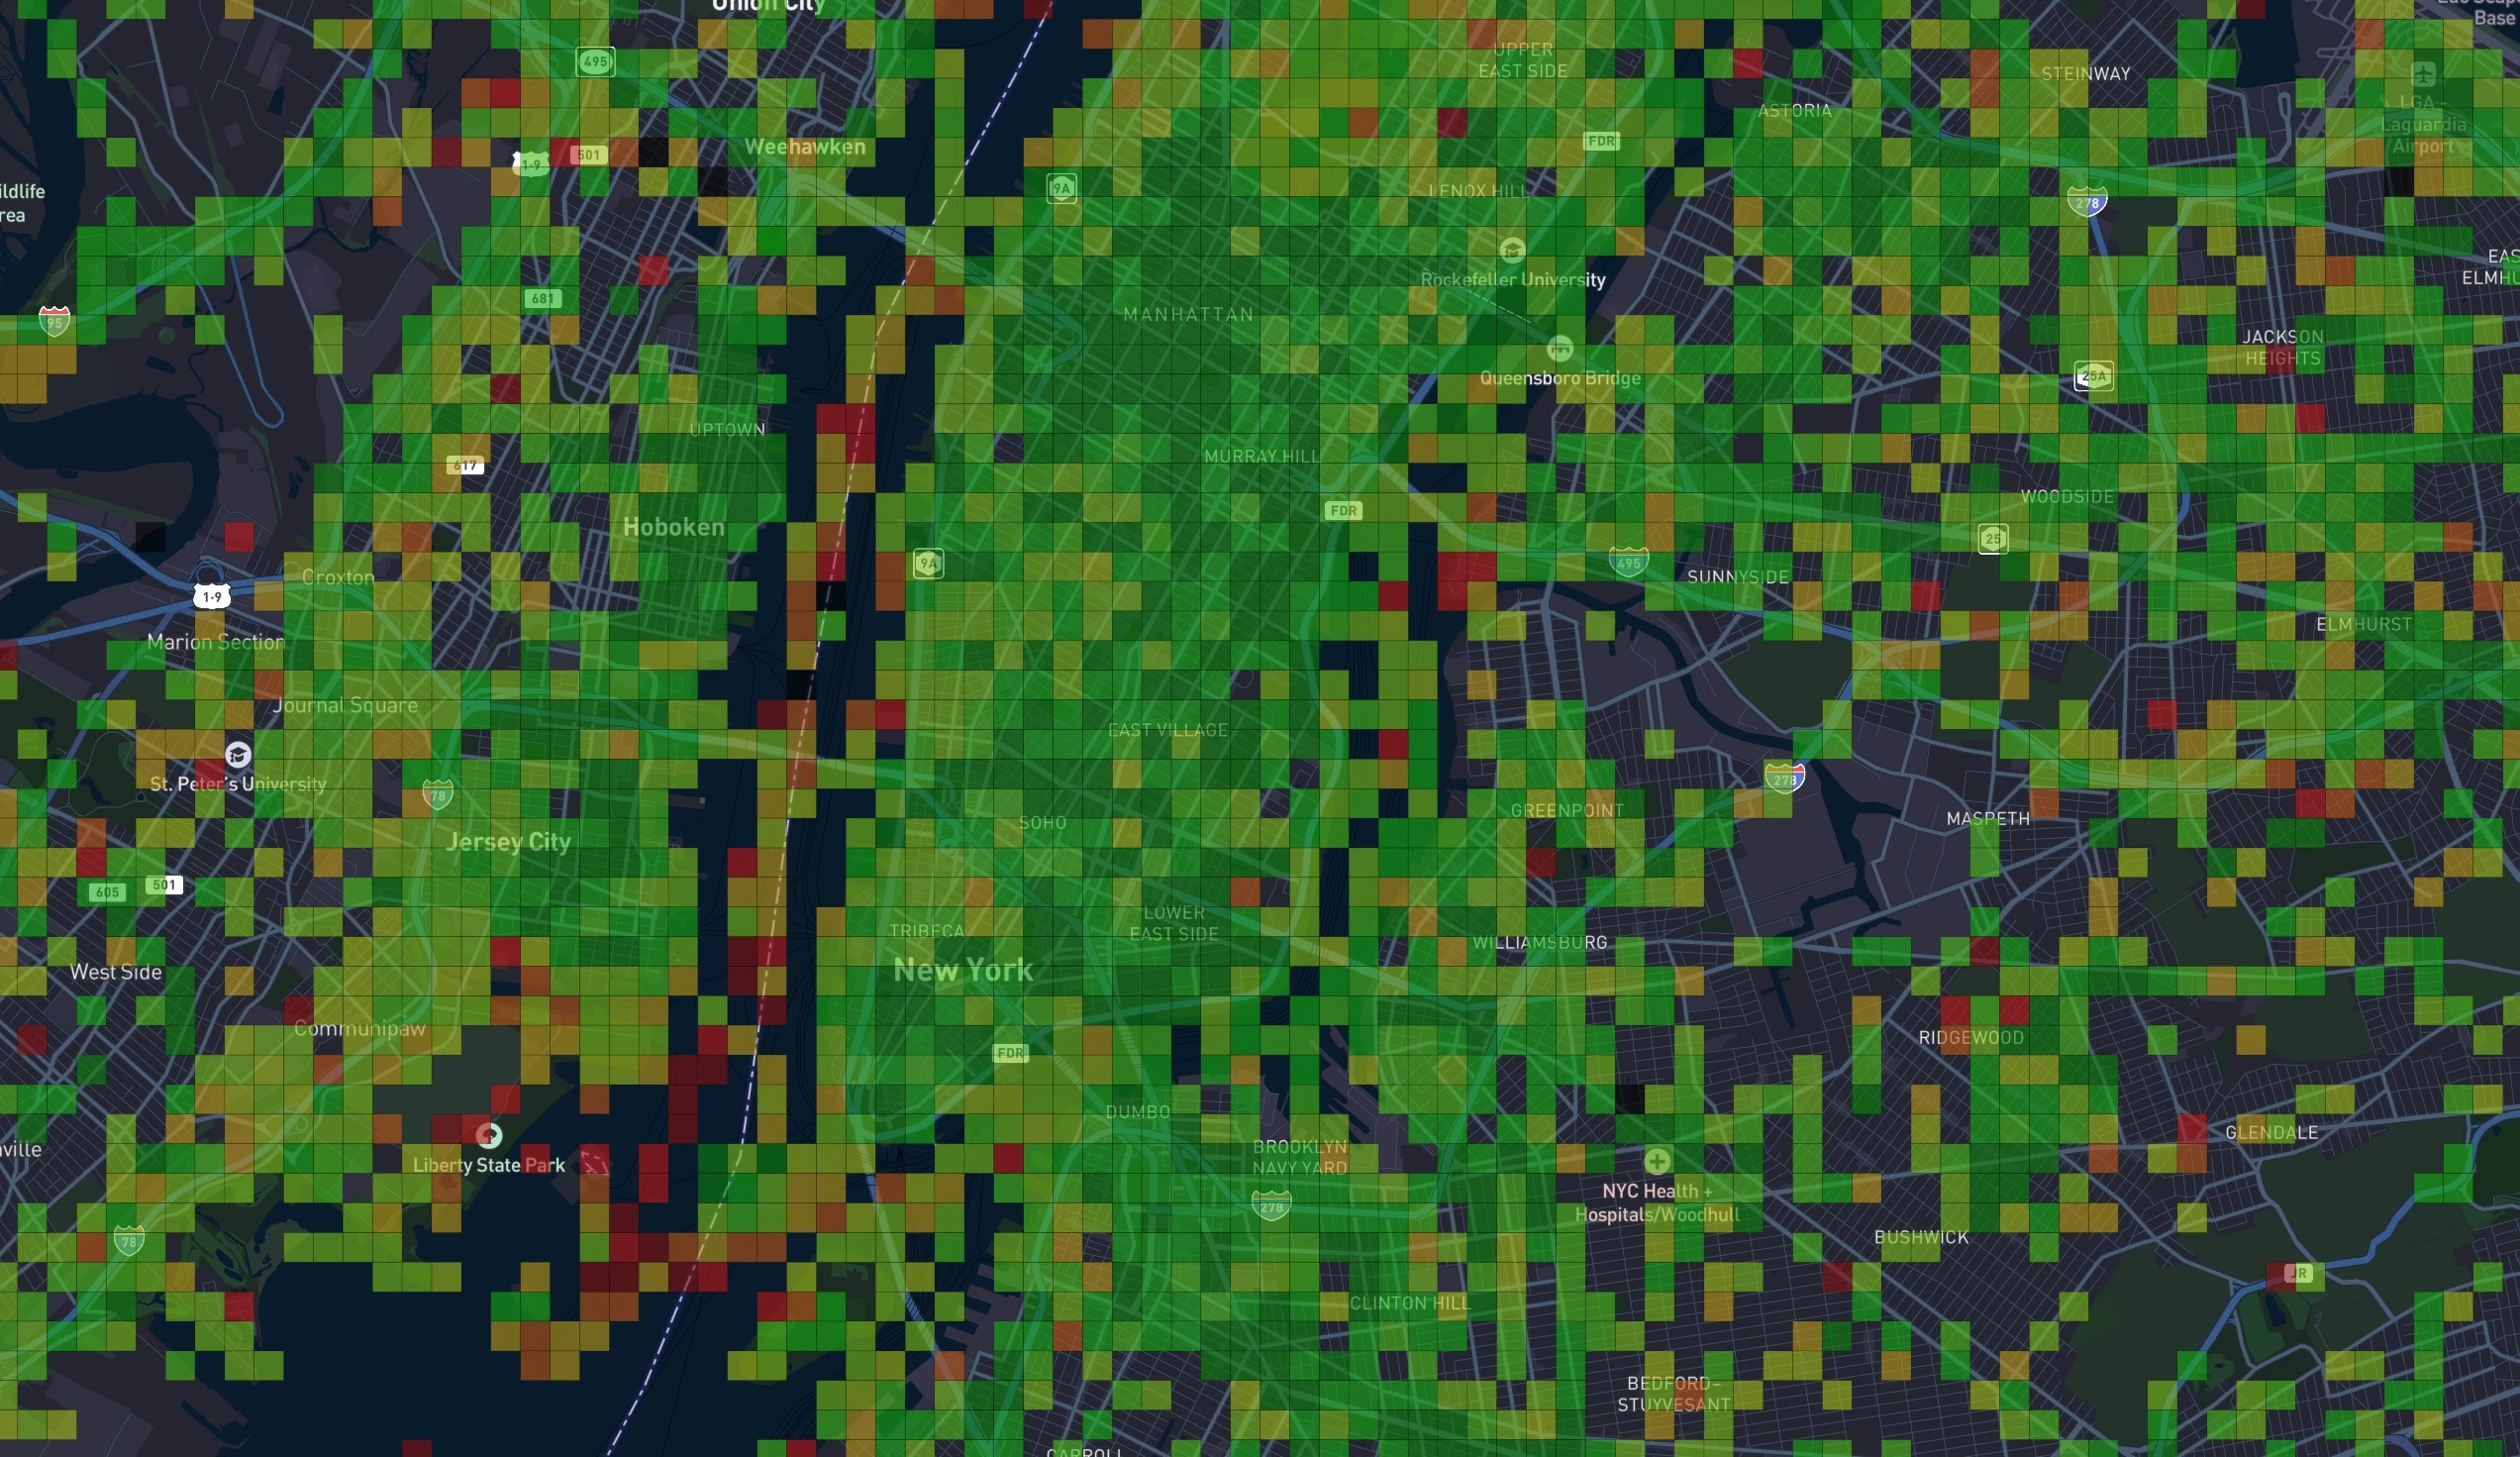
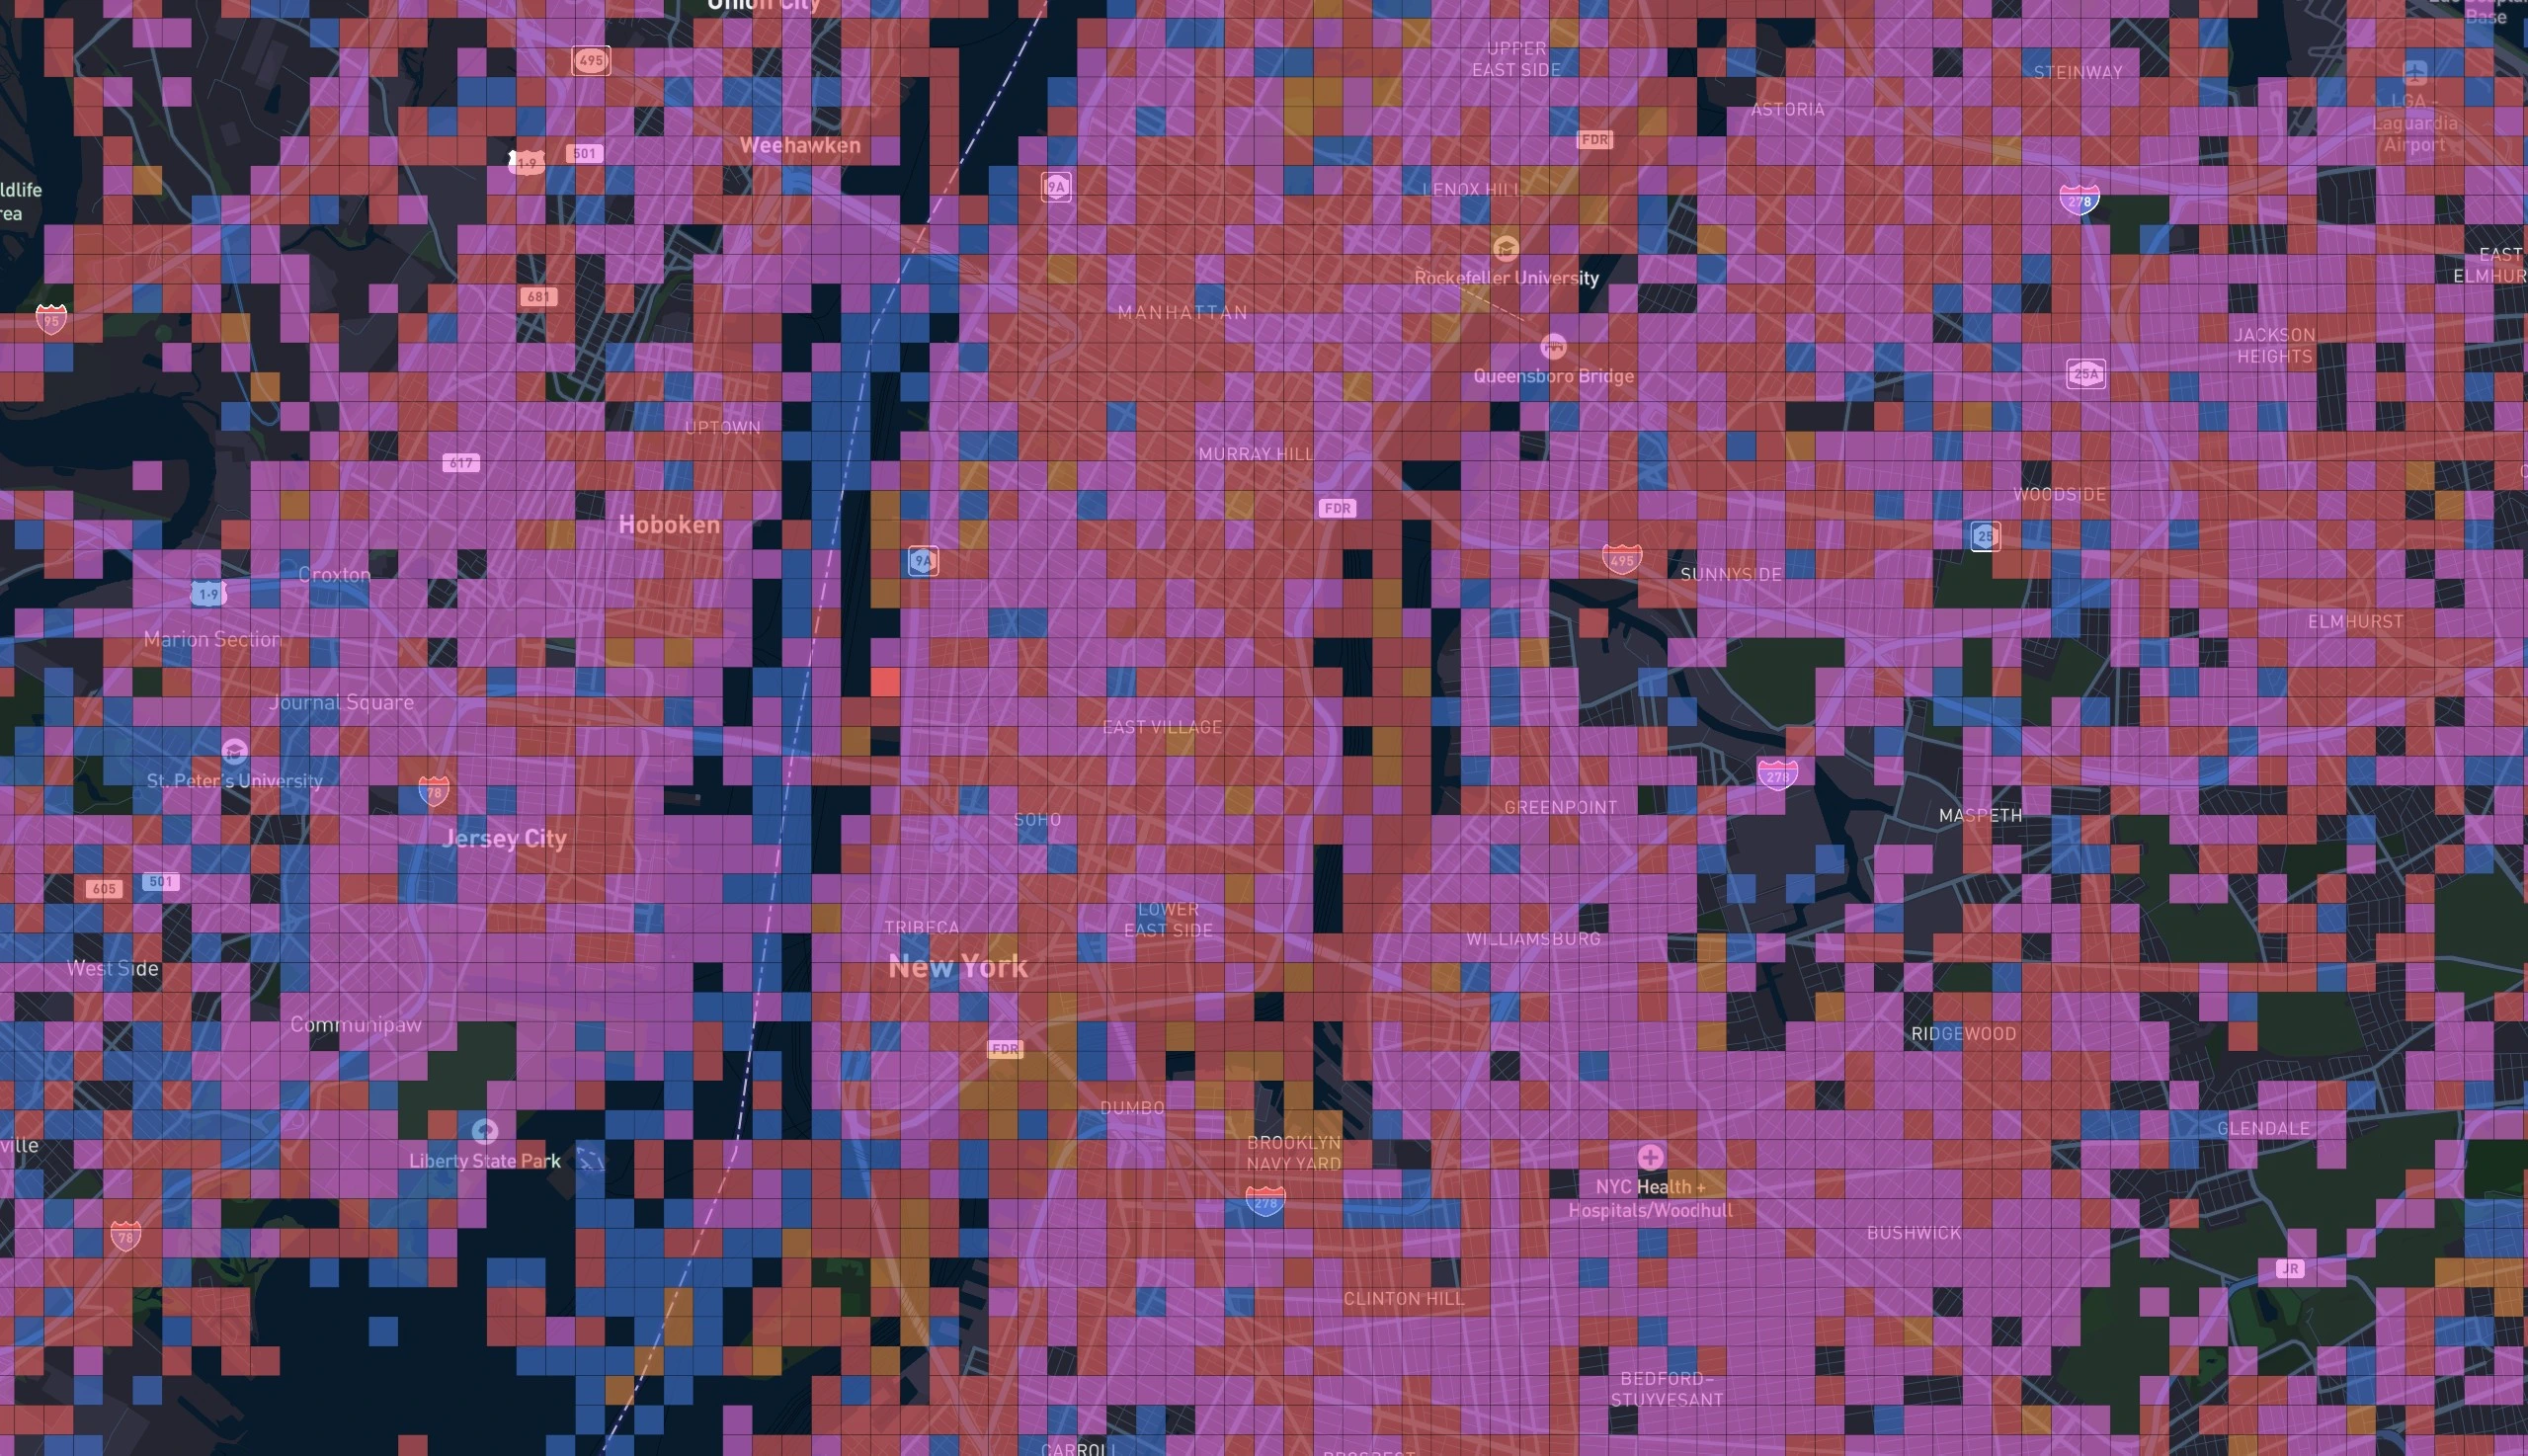
The Speed Test Map is a crowdsourced map of cellular data speeds.

Currently, the map is only available in the U.S. We plan on expanding the map to other countries before the end of the year.

The Speed Tes Map shows cellular data speeds on AT&T, T-Mobile, Verizon, Dish Wireless, and UScellular.

AT&T speed test map
Speed Test map filtered to show AT&T coverage

The Speed Test Map shows download speeds, upload speeds, and latency for all carriers.

Users contribute to the map by uploading speed tests. Tests can be run using the free Coverage Map app, or by other third-party apps such as SpeedSmart.

User running a speed test using the SpeedSmart application
Running a speed test using the free SpeedSmart app

Speed tests that are uploaded to CoverageMap.com are processed in real-time and show up on the Speed Test Map as hexagons.

Clicking on a hexagon gives you more information about the performance reported in that area.

You can see peak speeds, average speeds, median speeds, and compare performance between the different carriers.

Clicking on a square reveals more information about performance in that area.

You can use powerful filters and helpful color options to customize the Speed Test Map to meet your needs.

Powerful Filters

Filter by carrier, technology, and data speeds.

Filter by Carrier

See maps for Verizon, AT&T, T-Mobile, UScellular, and Dish.

Toggling between the different carriers is a great way to see how they compare in terms of coverage and data speeds.

Carrier filter
Network technology filter

Filter by Network Technology

See coverage areas for LTE, 5G, and Standalone 5G. Great for tracking 5G network deployments and checking 5G availability in your area.

Filter by Data Speeds

Only show hexagons that meet certain thresholds for download or upload speeds.

Ideal for finding areas that have mid-band or mmWave 5G deployed.

Or for simply finding a spot with speeds that are fast enough to get work done.

Data speed filter

Three Helpful Color Options

Style the map in a way that's most helpful to you.

Default color profile on the Speed Test map

Default

The default view color-codes the map to match the carrier you have selected. There are four color tiers for the hexagons. The darker colors indicate better performance.

Heat map color profile on the Speed Test map

Heat Map

The Heat Map color view adds more detail to the map. Instead of four color tiers, there are now nine color tiers. Dark red indicates areas with poor performance. Dark green shows areas with excellent performance.

Best Carrier color profile on the Speed Test map

Best Carrier

The Best Carrier view color-codes the hexagons to match the carrier with the best performance in a given hexagon.

Unique to CoverageMap.com, the Best Carrier view makes it easy to see what carrier has the best performance in any given area.

How the Speed Test Map Compares

You're getting a unique and powerful experience with the CoverageMap.com Speed Test Map. You won't find these features anywhere else. Period.

Coverage Maps
Signal Strength Map
Download Speed Map
Upload Speed Map
Ping Map
Filters
Filter by 5G or LTE
Filter by Network
Filter by Download Speeds
Filter by Upload Speeds
Filter by Standalone 5G
Filter by Your Own Speed Tests
Advanced Map Coloring
Color by Fastest Speeds
Color by Average Speeds
Color by Median Speeds
Heat Map
Color by Best Network
Them

How does the Speed Map work?

The Speed Map works by empowering users to upload real-world performance data to the map by running speed tests. The map updates in real-time people contribute data, helping everyone get a clearer picture of what coverage is truly like.

Coverage Map app
icon of user

1. Create a free account

Create your free account to enjoy three key benefits:

  1. Your own personal coverage map
  2. The ability to compete on the state and national leaderboards by earning points
  3. The ability to unlock fun achievements

2. Run Tests

Use the free Coverage Map app to measure your cellular connection. Your speed tests are processed in real-time and are instantly viewable on the map.

icon of map

3. Explore the map

Compare cell phone coverage and performance. Set custom filters. See what network is best in your area.

Don't miss amazing updates

Join the email list so you're the first to know about new features.

Your message has been submitted.
We will get back to you within 24-48 hours.
Oops! Something went wrong :(