Coverage Tile API
Integrate coverage signal strength data into your map with MVT tiles for any U.S. carrier.
14-day free trial. No credit card required.

Key Features
Everything you need to integrate cellular coverage data into your applications.
Integrate Cell Coverage with Ease
Add carrier-specific 4G LTE and 5G tile layers to your map with just a few lines of code.
Quick Integration
Get up and running in minutes with our well-documented APIs. Copy the example below to start integrating coverage data into your application.
- Comprehensive API documentation
- Easy carrier and technology filtering
- Uses standardized MVT tiles for fast map integration
https://enterprise.coveragemap.com/api/v1/signal-strength/tiles/{provider}/{z}/{x}/{y}?technology={technology}Dive deeper into Coverage Tile API
Explore the technical details, data coverage, and real-world use cases so your team can plan a confident rollout.
What is the Coverage Tile API?
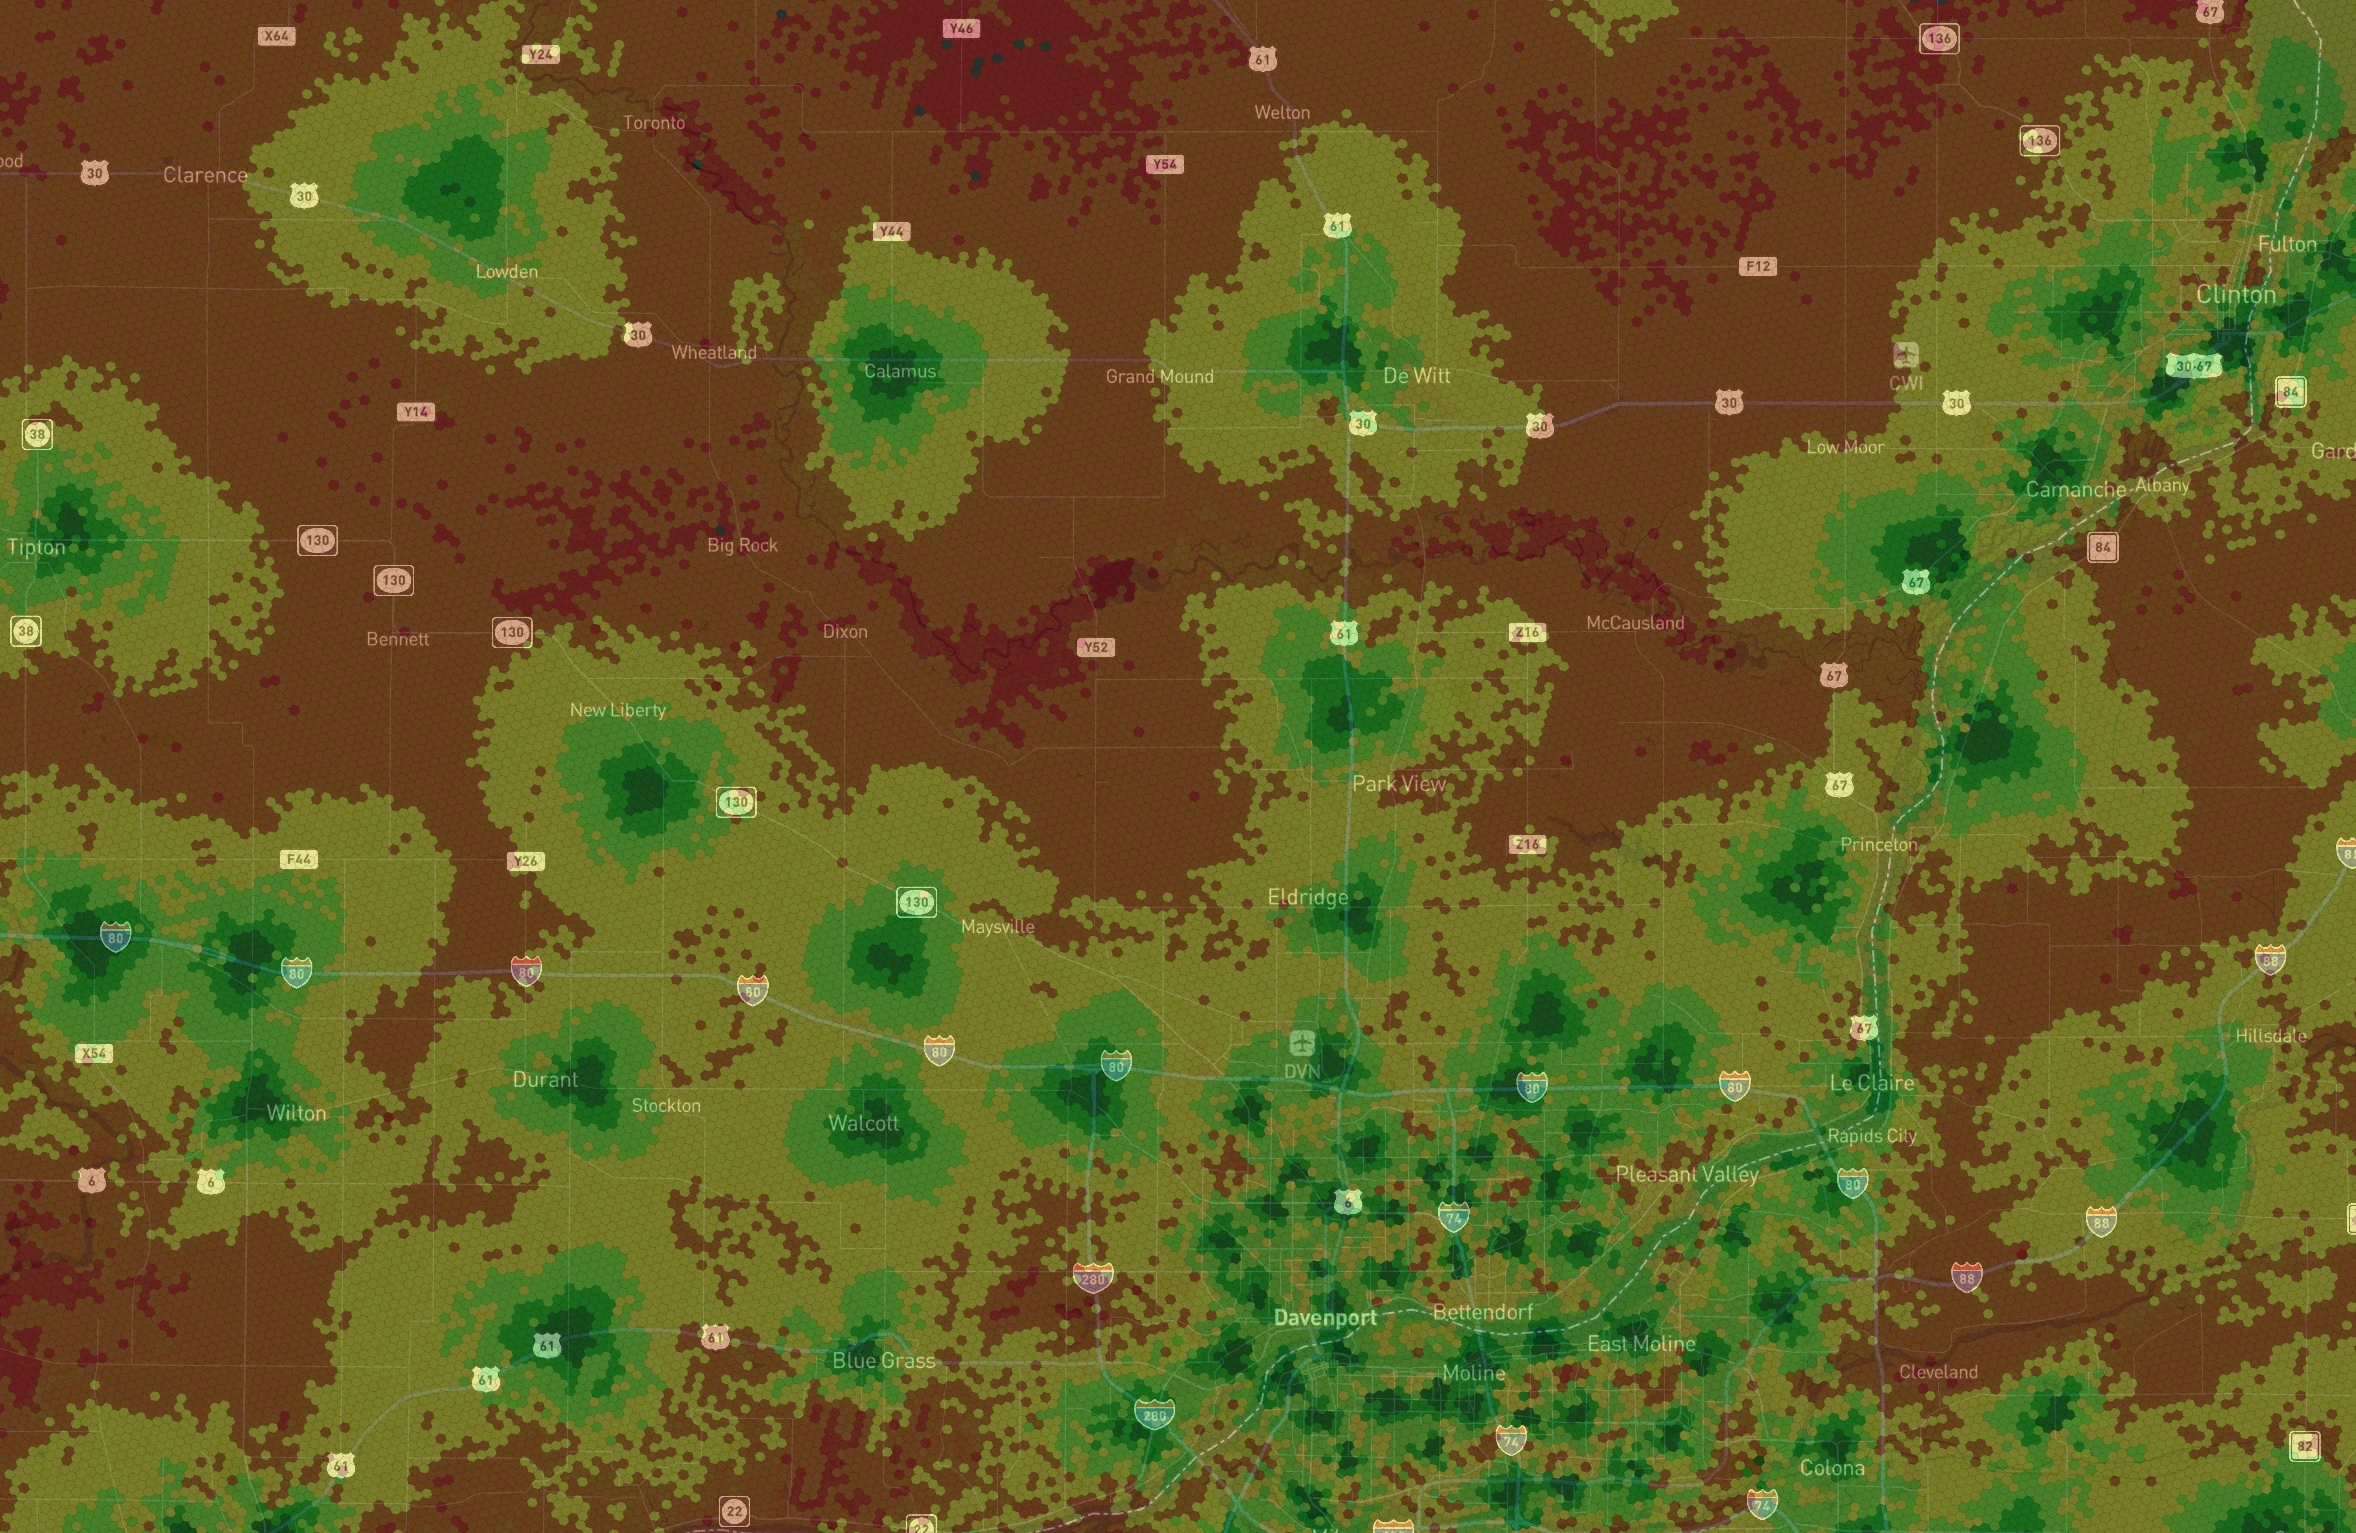
The Coverage Tile API delivers map-ready coverage and signal strength tiles based on the FCC Broadband Data Collection data set that integrates directly into your existing mapping application. Use it to visualize carrier footprints and quality at any zoom level without building and maintaining a tile pipeline.
You get access to coverage footprints and signal strength quality, measured in dBm, for AT&T, T-Mobile, Verizon, Boost Mobile, and UScellular. Regional carriers are available upon request.
The data is available as Mapbox Vector Tiles (MVT).
Granular to Country-Wide
Our tiles automatically handle zoom levels from 0 through 10. Get granular data, about 600 feet per data point, or view a nationwide coverage footprint. The data is available for both 4G LTE and 5G networks.
See an example of the tiles in action on our Signal Strength Map.
Integrate with Ease
Get set up in under an hour with our easy-to-follow documentation and guides.
Example URL:
- Pick Your Provider: Select if you want AT&T, T-Mobile, Verizon, Boost Mobile, or UScellular
- Filter The Technology: Select if you want 4G LTE, 5G, or both
- Add To Your Map: Add the tile source as a new layer to your map
Pricing
Predictable tile usage pricing with a custom plan available.
- 30,000 tile loads included
- $5 per 1,000 additional tile loads
- Coverage and signal data
- 4G LTE and 5G
- AT&T, T-Mobile, Verizon, Boost Mobile, and UScellular
- Non-commercial license
- 250,000 tile loads included
- $2.50 per 1,000 additional tile loads
- Coverage and signal data
- 4G LTE and 5G
- AT&T, T-Mobile, Verizon, Boost Mobile, and UScellular
- Non-commercial license
- Coverage and signal strength data
- 4G LTE and 5G
- AT&T, T-Mobile, Verizon, Boost Mobile, and UScellular
- Additional regional carriers available upon request
- Volume discounts
- Pricing built for you
- Non-commercial & commercial licenses available
Use Cases
Put coverage tiles to work in mapping, planning, and customer experiences.
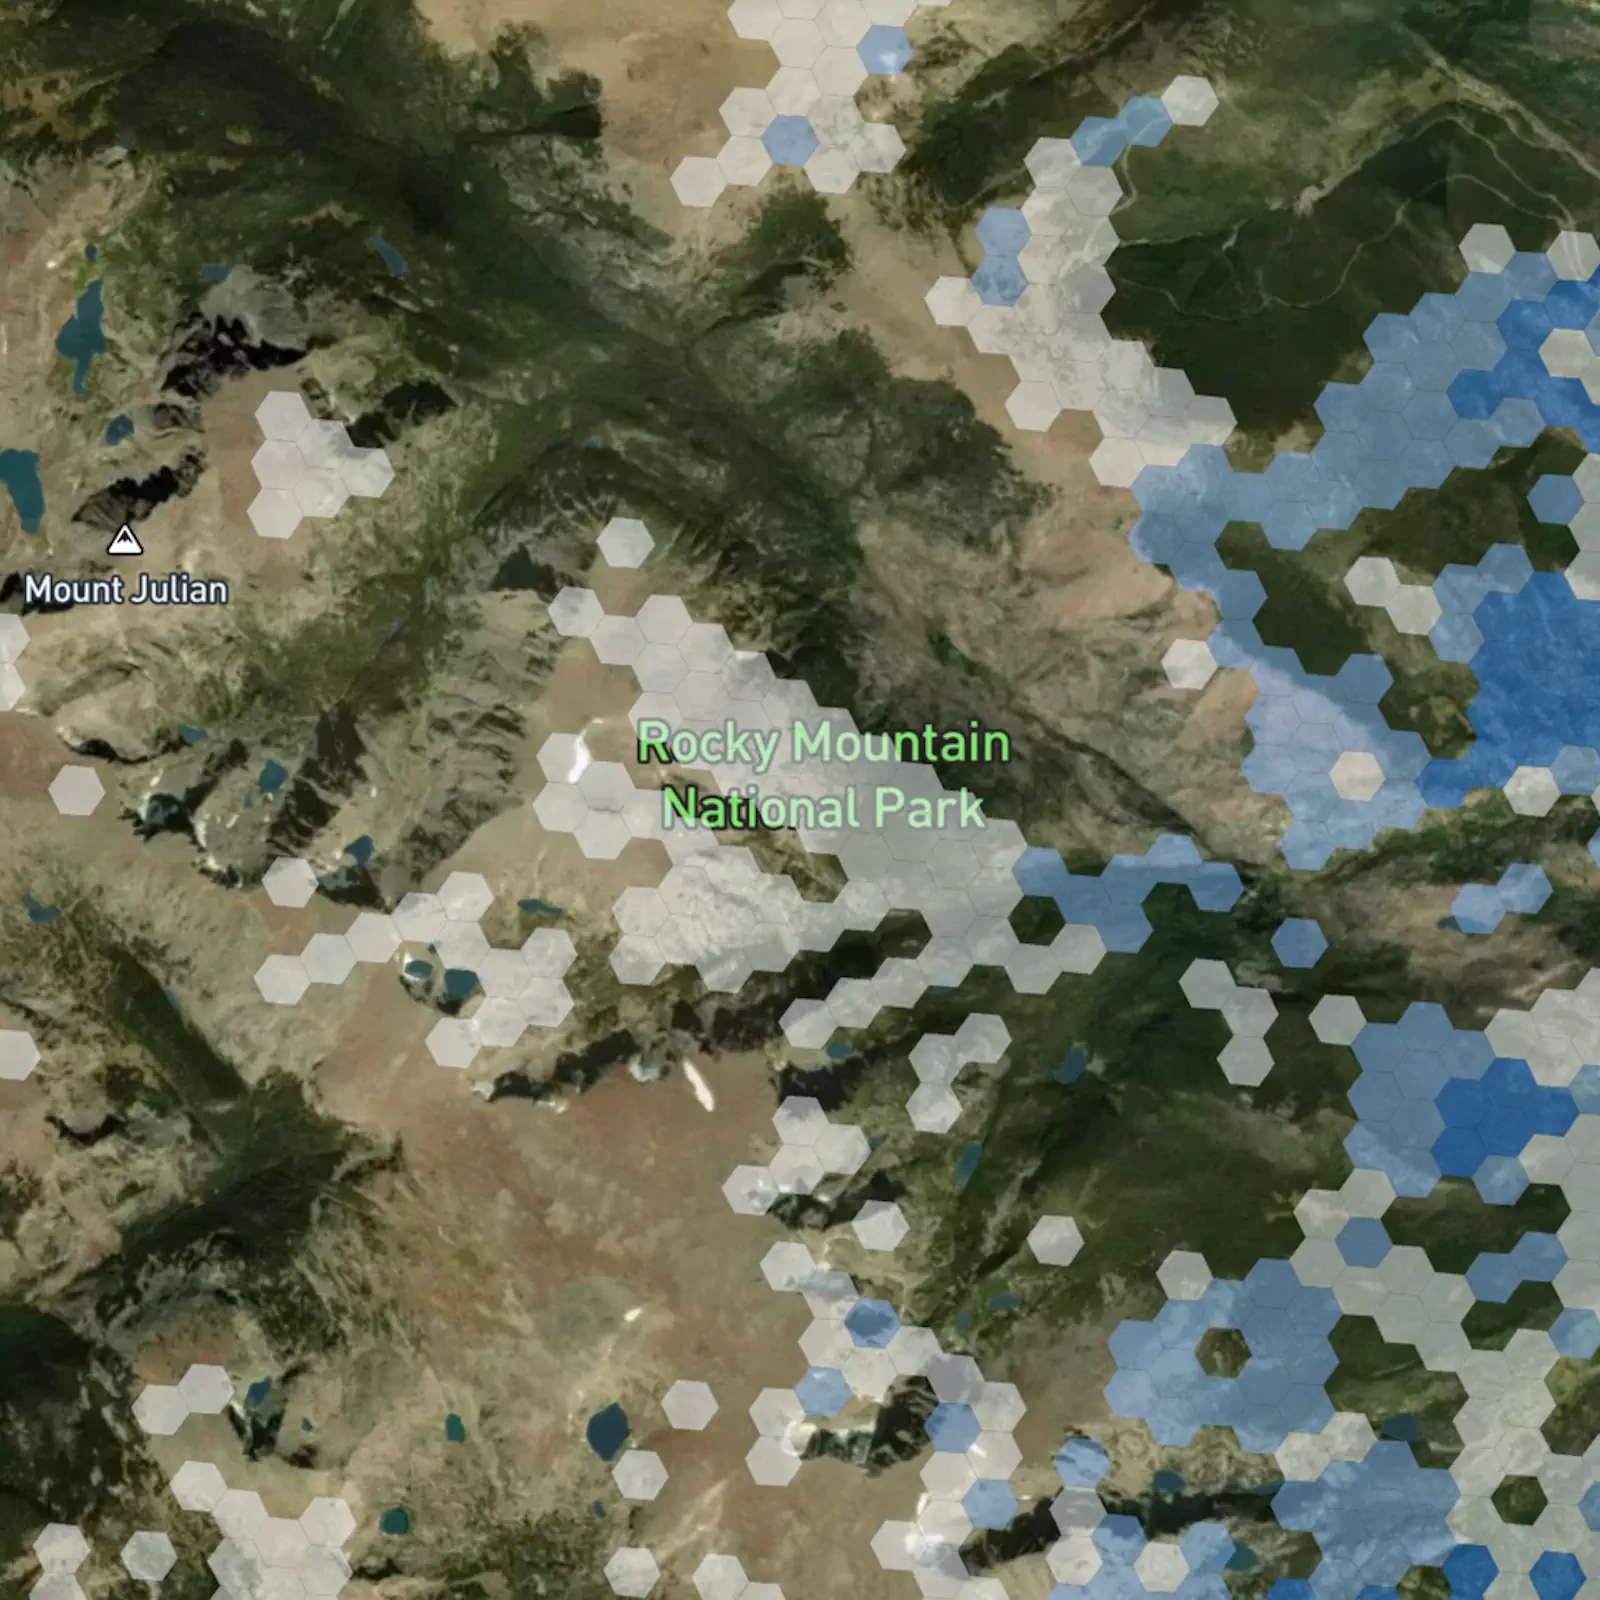
Integrate Into Parks & Services
Show visitors to highly trafficked parks and recreational areas where they can find cell service. Helpful for emergencies and keeping visitors safe and connected.
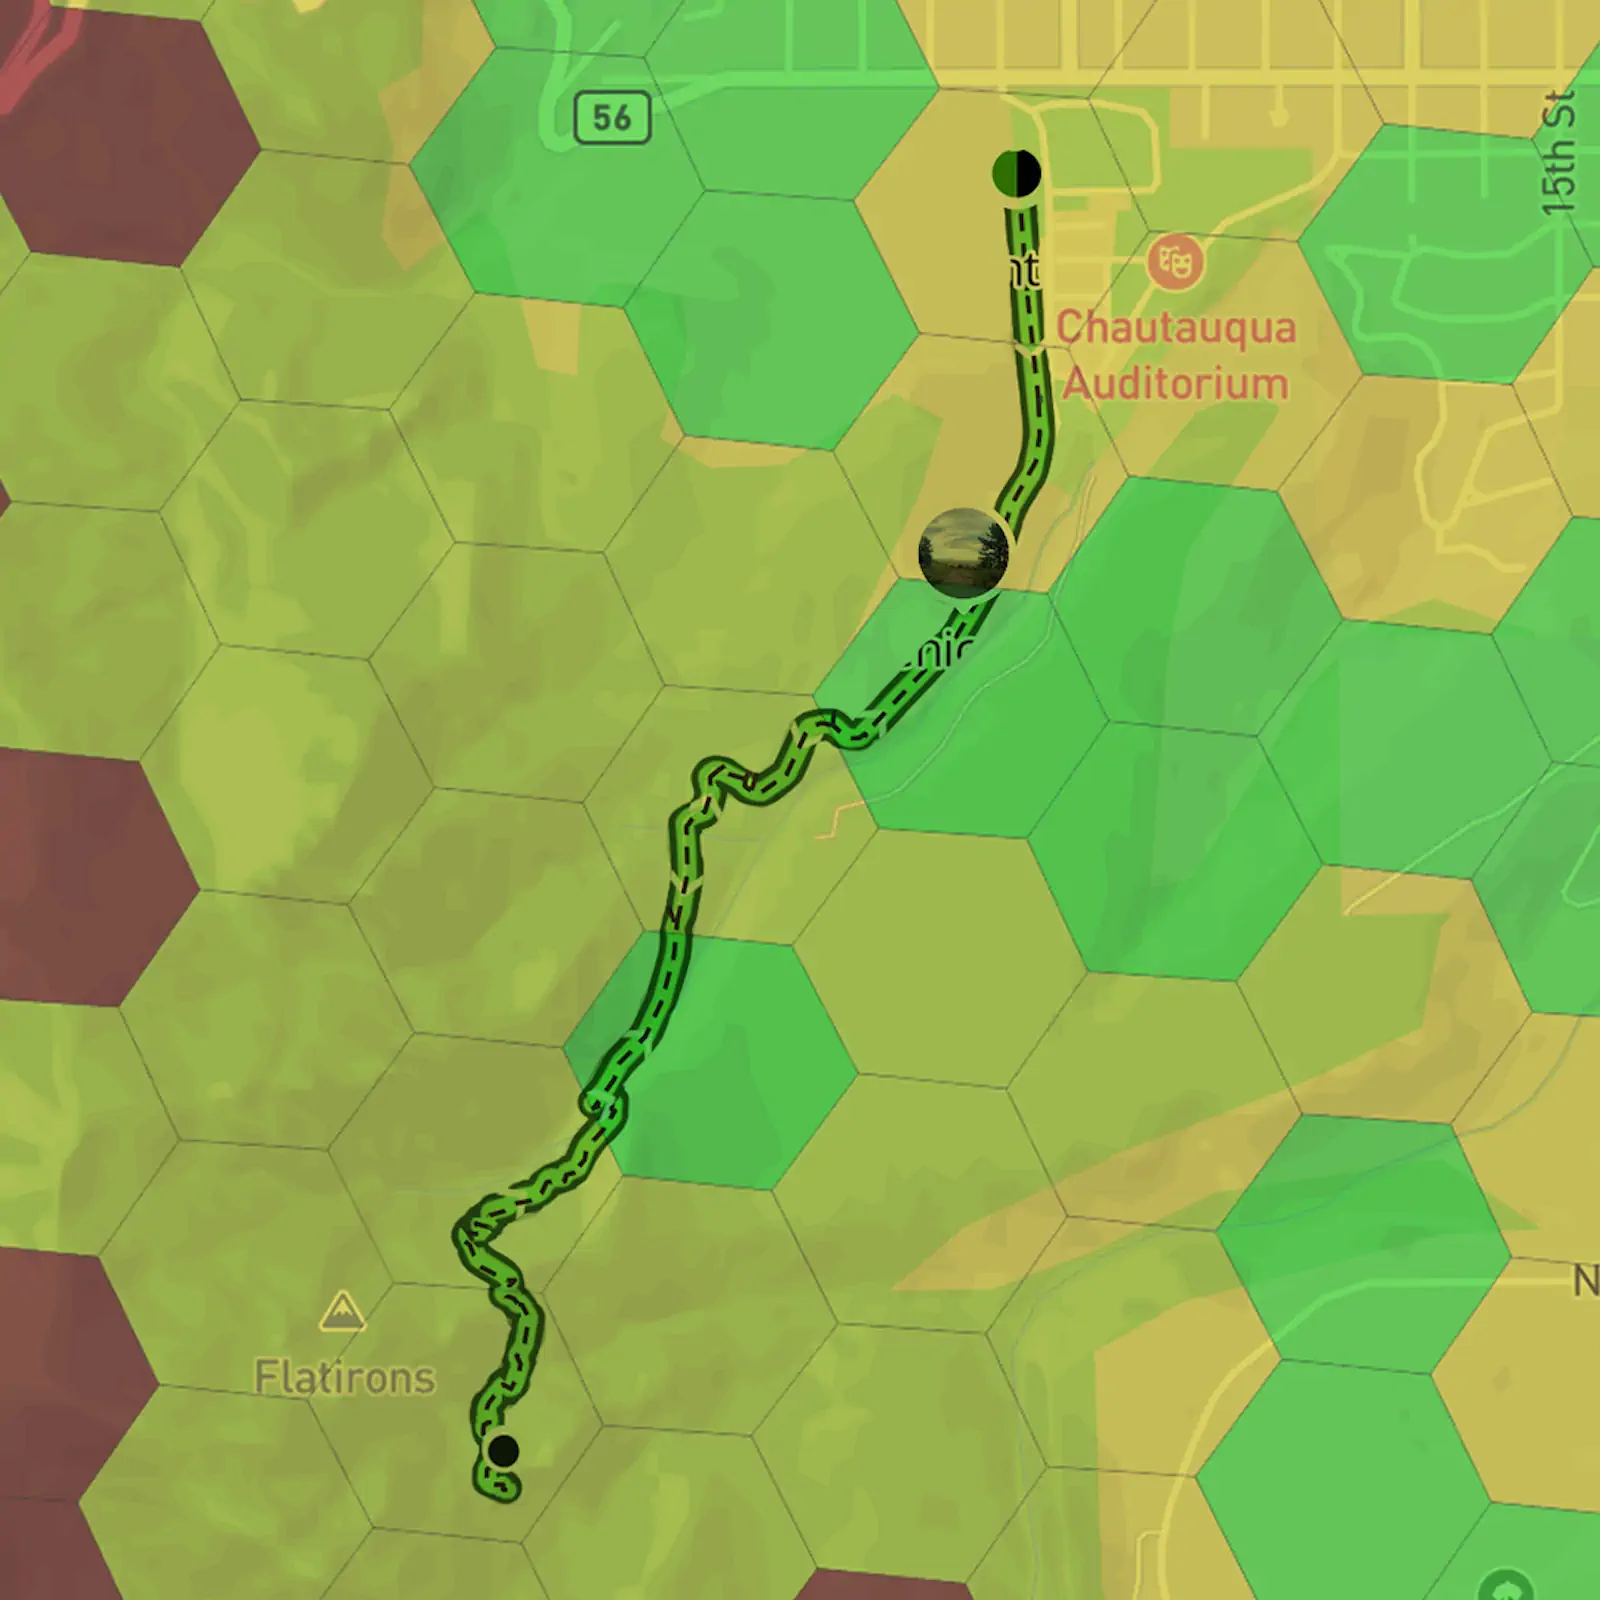
Overlay on Hiking & Biking Trails
Keep your riders and outdoor adventure seekers safe and connected. Let them know where along their route they can find service to phone a friend, or post that incredible photo they just took.
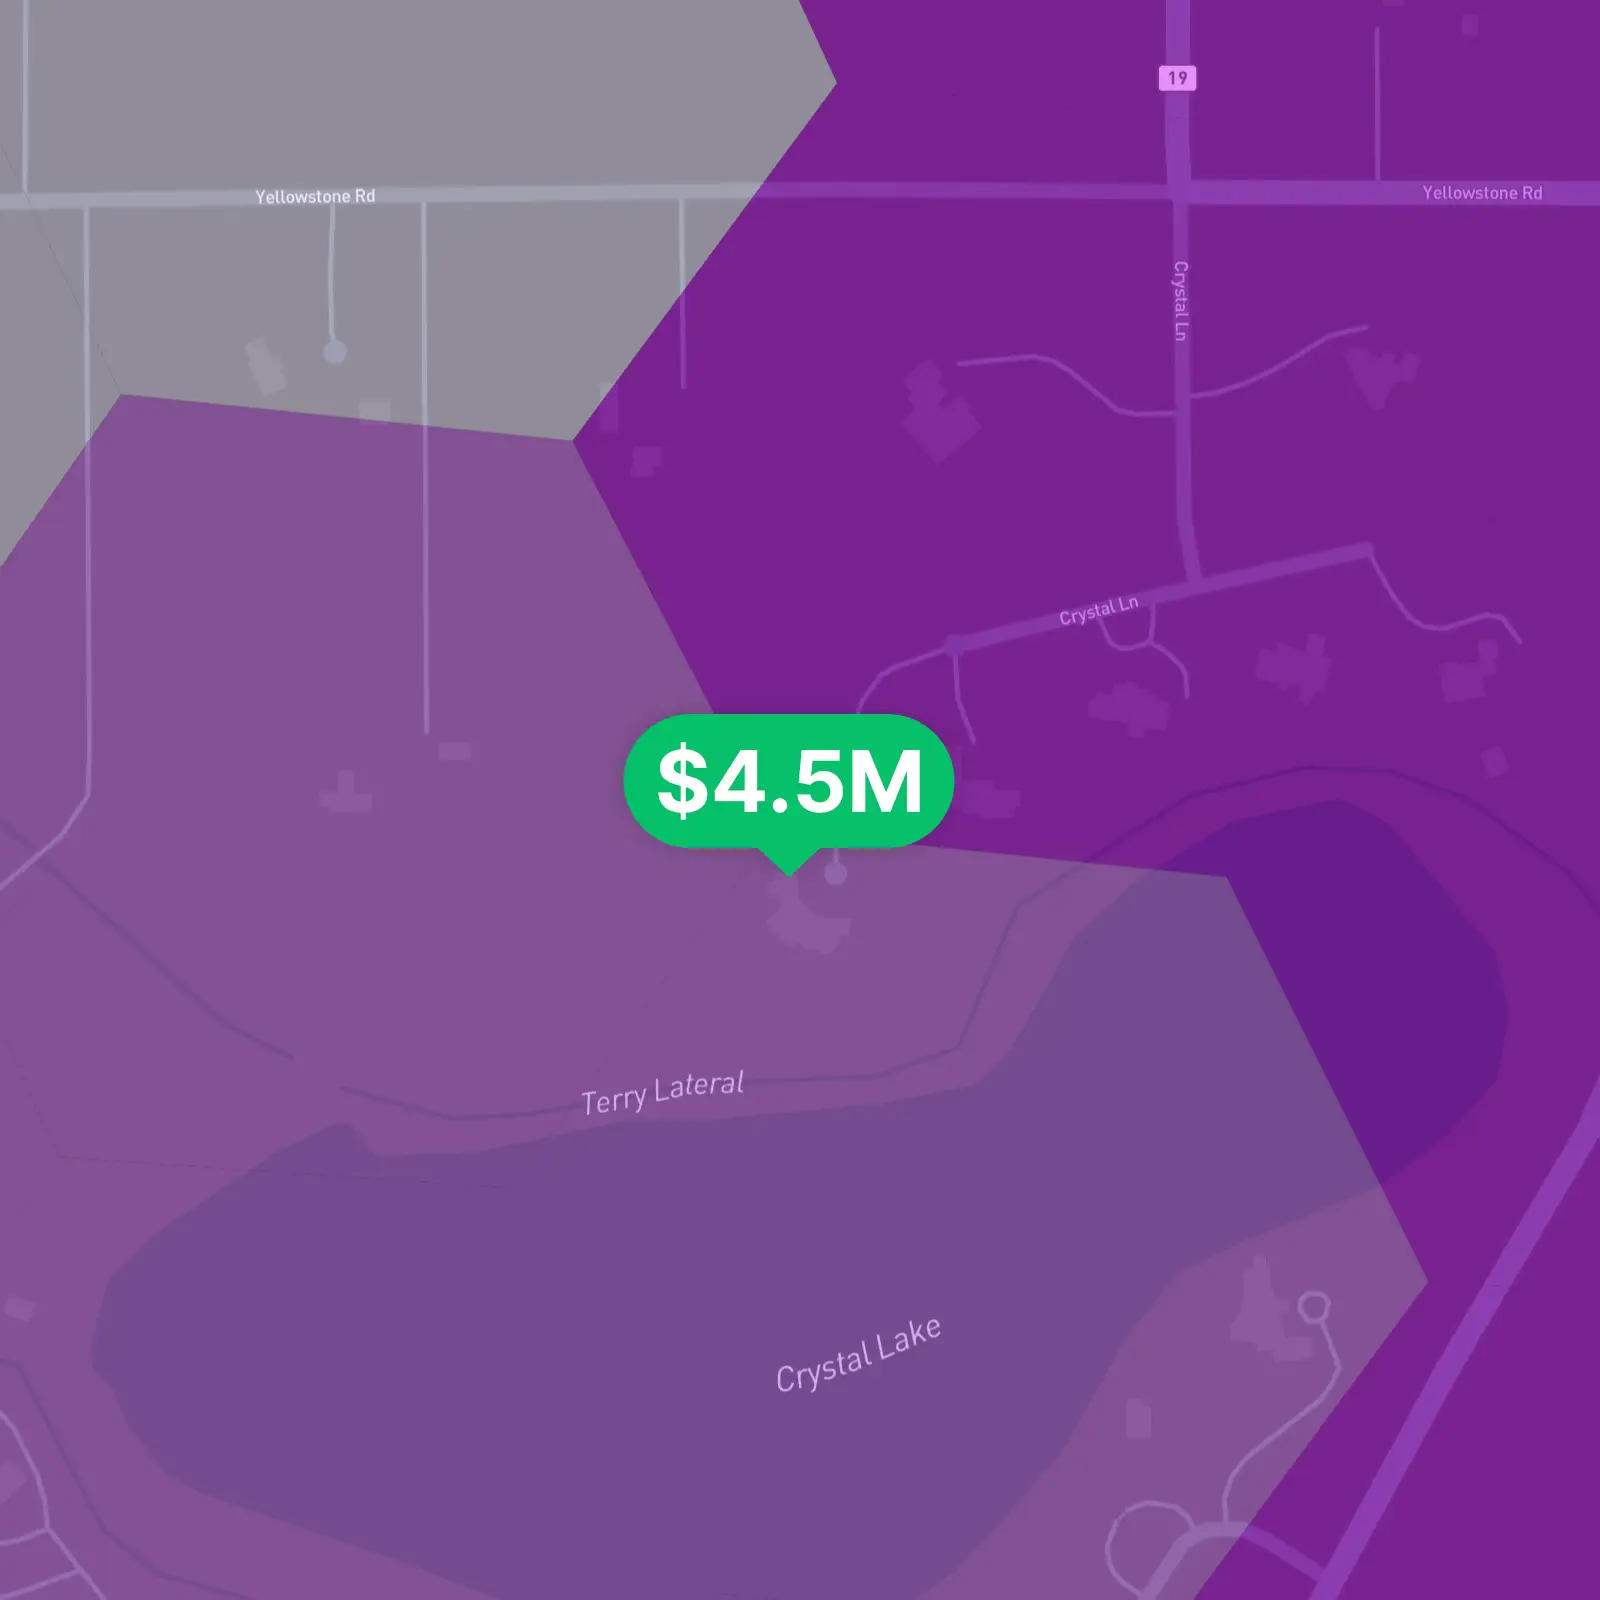
Help Homebuyers Find the Best Carrier
Before someone plops down $4.5 million for their new lakeside property, help them figure out if their current phone service will work there or if a new carrier is a better fit.
Why chose CoverageMap.com?
We provide crowdsourced and data-driven maps and APIs of cellular network coverage and performance. Our mission is to help you and your business understand and compare coverage, speed, and signal quality between the carriers.
Where’s the data from?
All of our signal strength data is sourced from the FCC Broadband Data Collection. Our proprietary data processing pipeline handles discrepancies, inconsistencies, or other quality issues with data from the FCC, ensuring you get the most accurate and reliable coverage information possible.
Frequently Asked Questions
What does the free trial include?
The free trial is for 14 days and includes 1,000 tile loads. The output data can only be used for demo or trial purposes and cannot be used outside of that.
Will the tiles be cached?
The tiles will be cached by default for 1 hour in the browser.
How does billing work?
You are billed once for every tile loaded, regardless of provider or technology. For example, if you load the Verizon 4G LTE tile (1,2,1) and then the Verizon 5G tile (1,2,1), you will be billed twice.
Am I billed for cached tile loads?
No, you are not billed for tiles loaded from the cache.
Can I modify the cache time?
No, you are not allowed to modify the cache time in any way, and you are also prohibited from adding a proxy layer in front of the API with the purpose of caching any responses.
What format do I get the data in?
Once your locations are processed, you will get the data back in the form of a CSV file and an Excel file. If you are interested, you can also access the signal strength data through our Coverage API or Coverage Tiles.
How do we ensure data accuracy?
We have a custom data processing pipeline to apply corrections to the FCC data. This includes dealing with inaccuracies and discrepancies, and applying our correction algorithm to normalize the data between carriers.
Can I track my usage?
Yes. You can track your usage in real-time from your dashboard and see usage broken down day-by-day.
What countries are supported?
The Coverage Tile API is only available in the United States.
Ready to get started?
Start your free 14-day trial today. No credit card required. Get instant access to the Coverage Tile API.