Coverage Map App Launches on the Google Play Store
Four months ago, we launched the Coverage Map app on iPhone and iPad.
Since then, we have gotten one popular question: When is the app coming to Android?
Today, we have an answer.
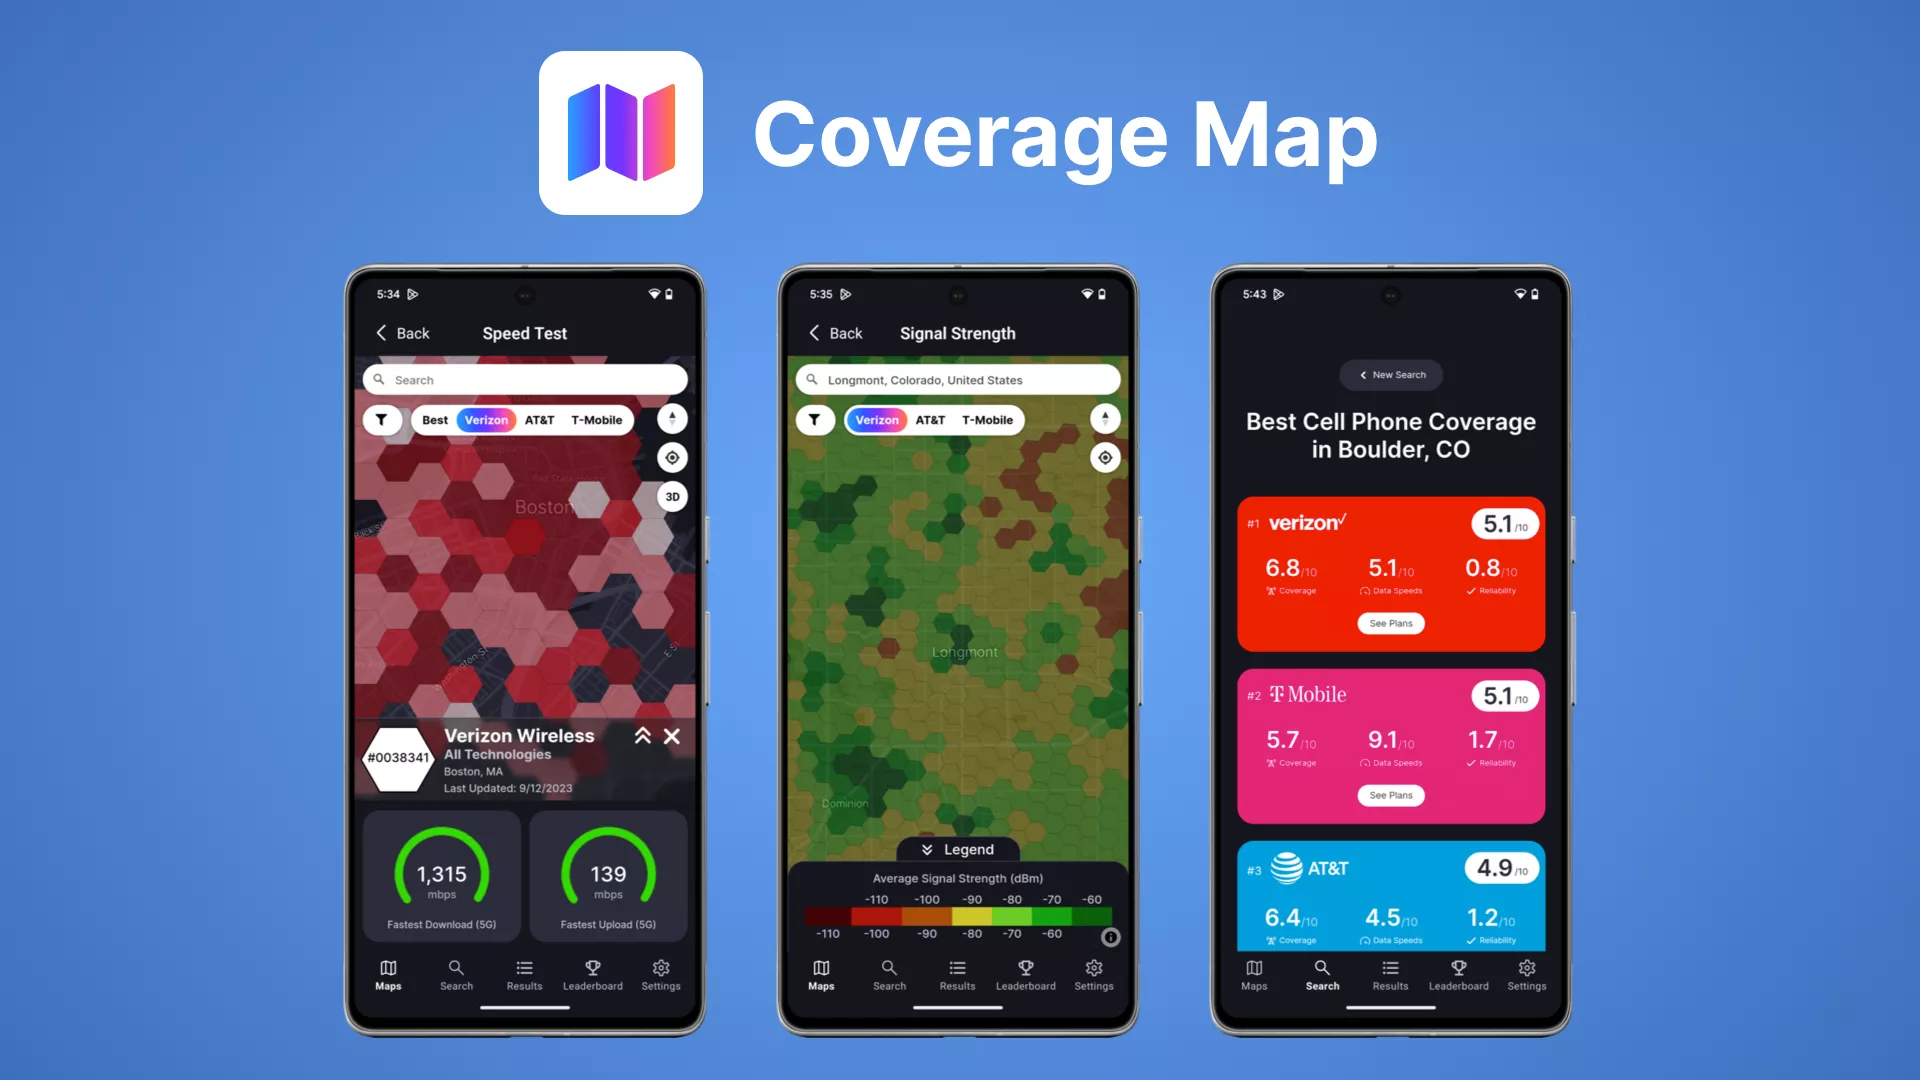
We are excited to announce that the Coverage Map app for Android is now available for FREE on the Google Play Store.
Re-built from the Ground-up
Android uses an entirely different programming language than iOS. We chose to re-build the Android app from the ground up in Java to make the app feel fast and responsive.
The Speed Map
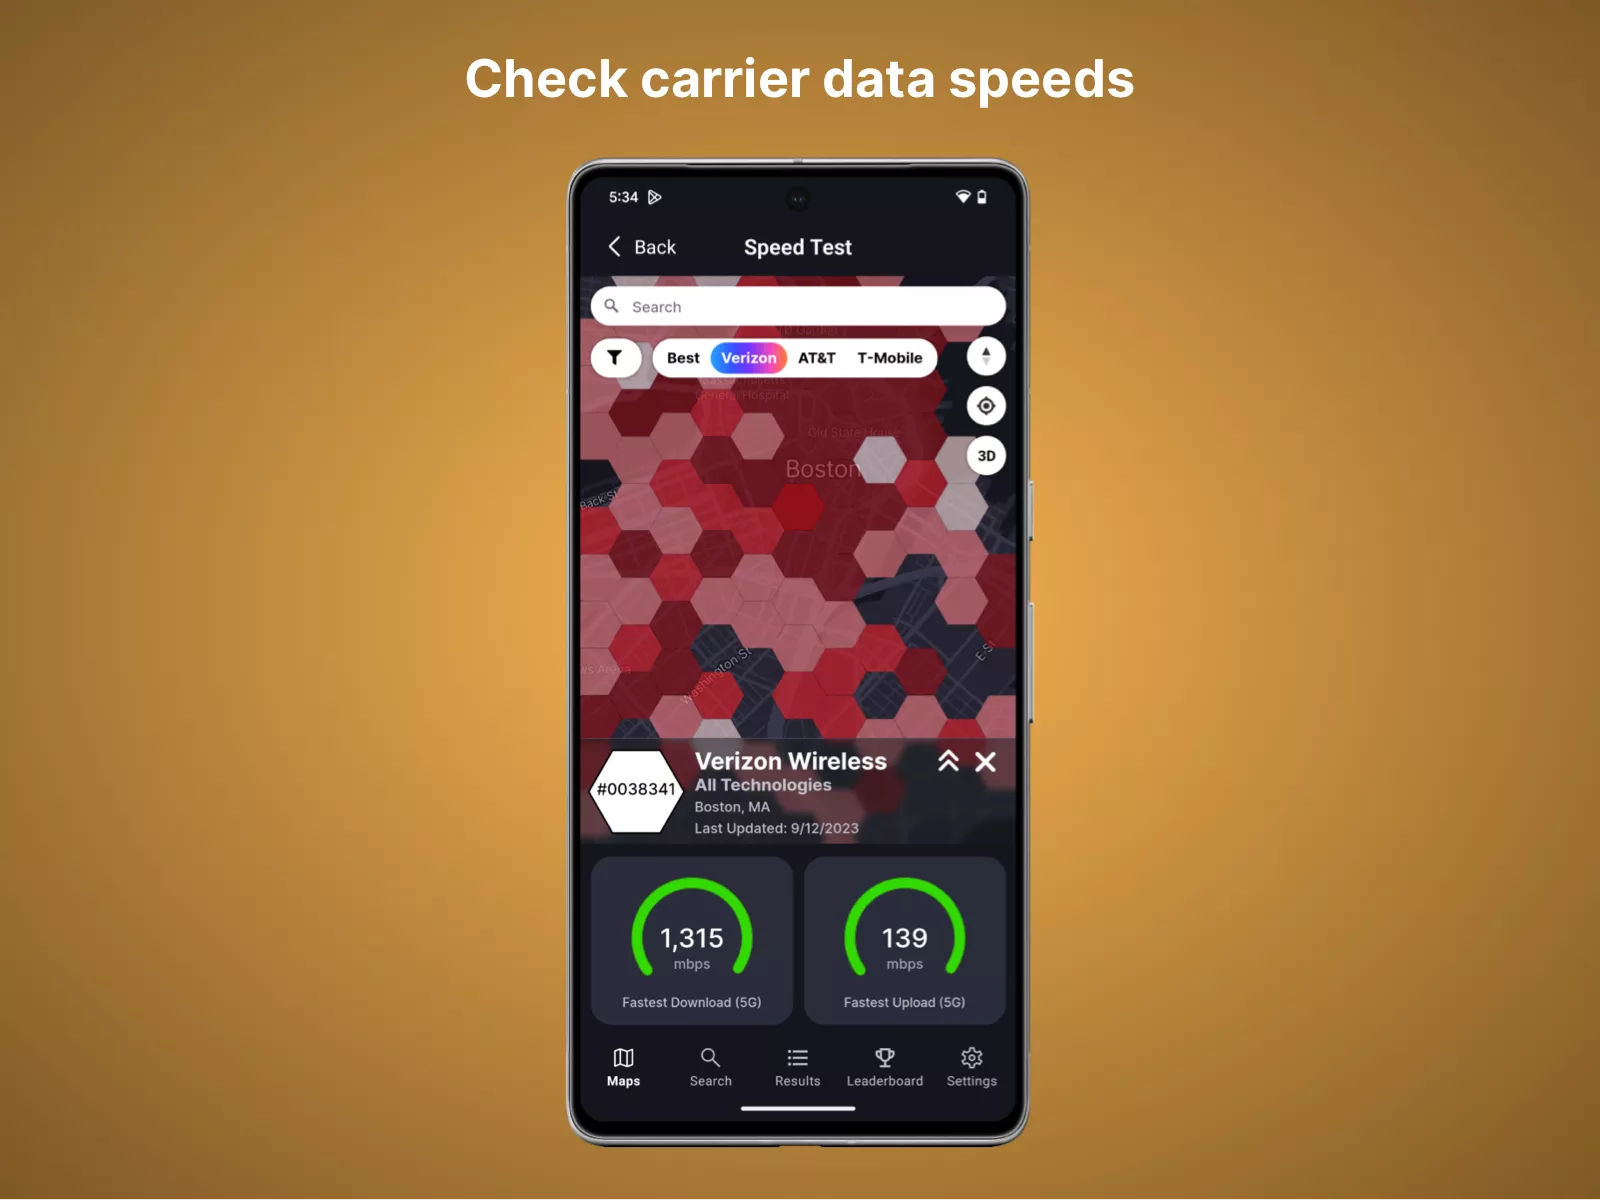
The Speed Map is the flagship map of CoverageMap.com. It is a crowd-sourced map made up of millions of speed tests.
Each speed test is represented by a hexagon. Darker hexagons indicate better performance. You can tap any hexagon to see download speeds, upload speeds, and latency.
Advanced filters let you customize the Speed Map view.
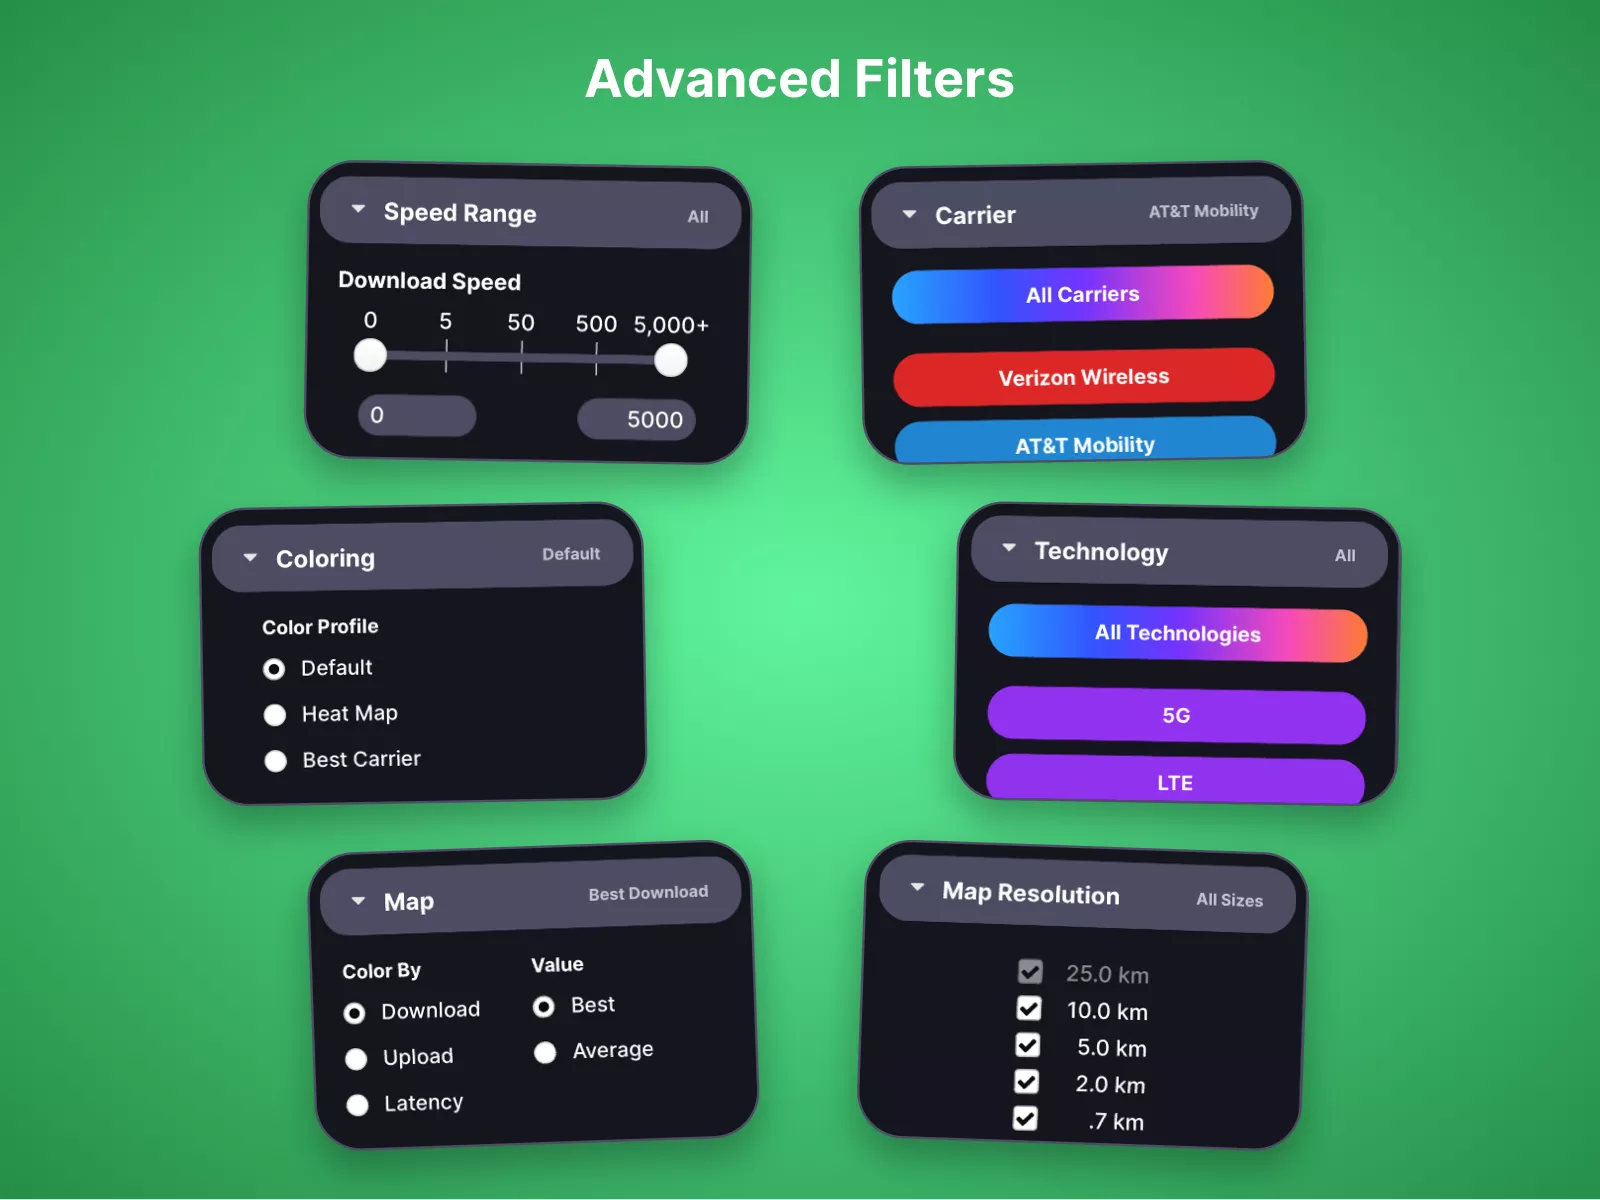
Filter by carrier, 4G LTE or 5G, data speeds, and color profiles such as heat map or best carrier.
The Signal Strength Map
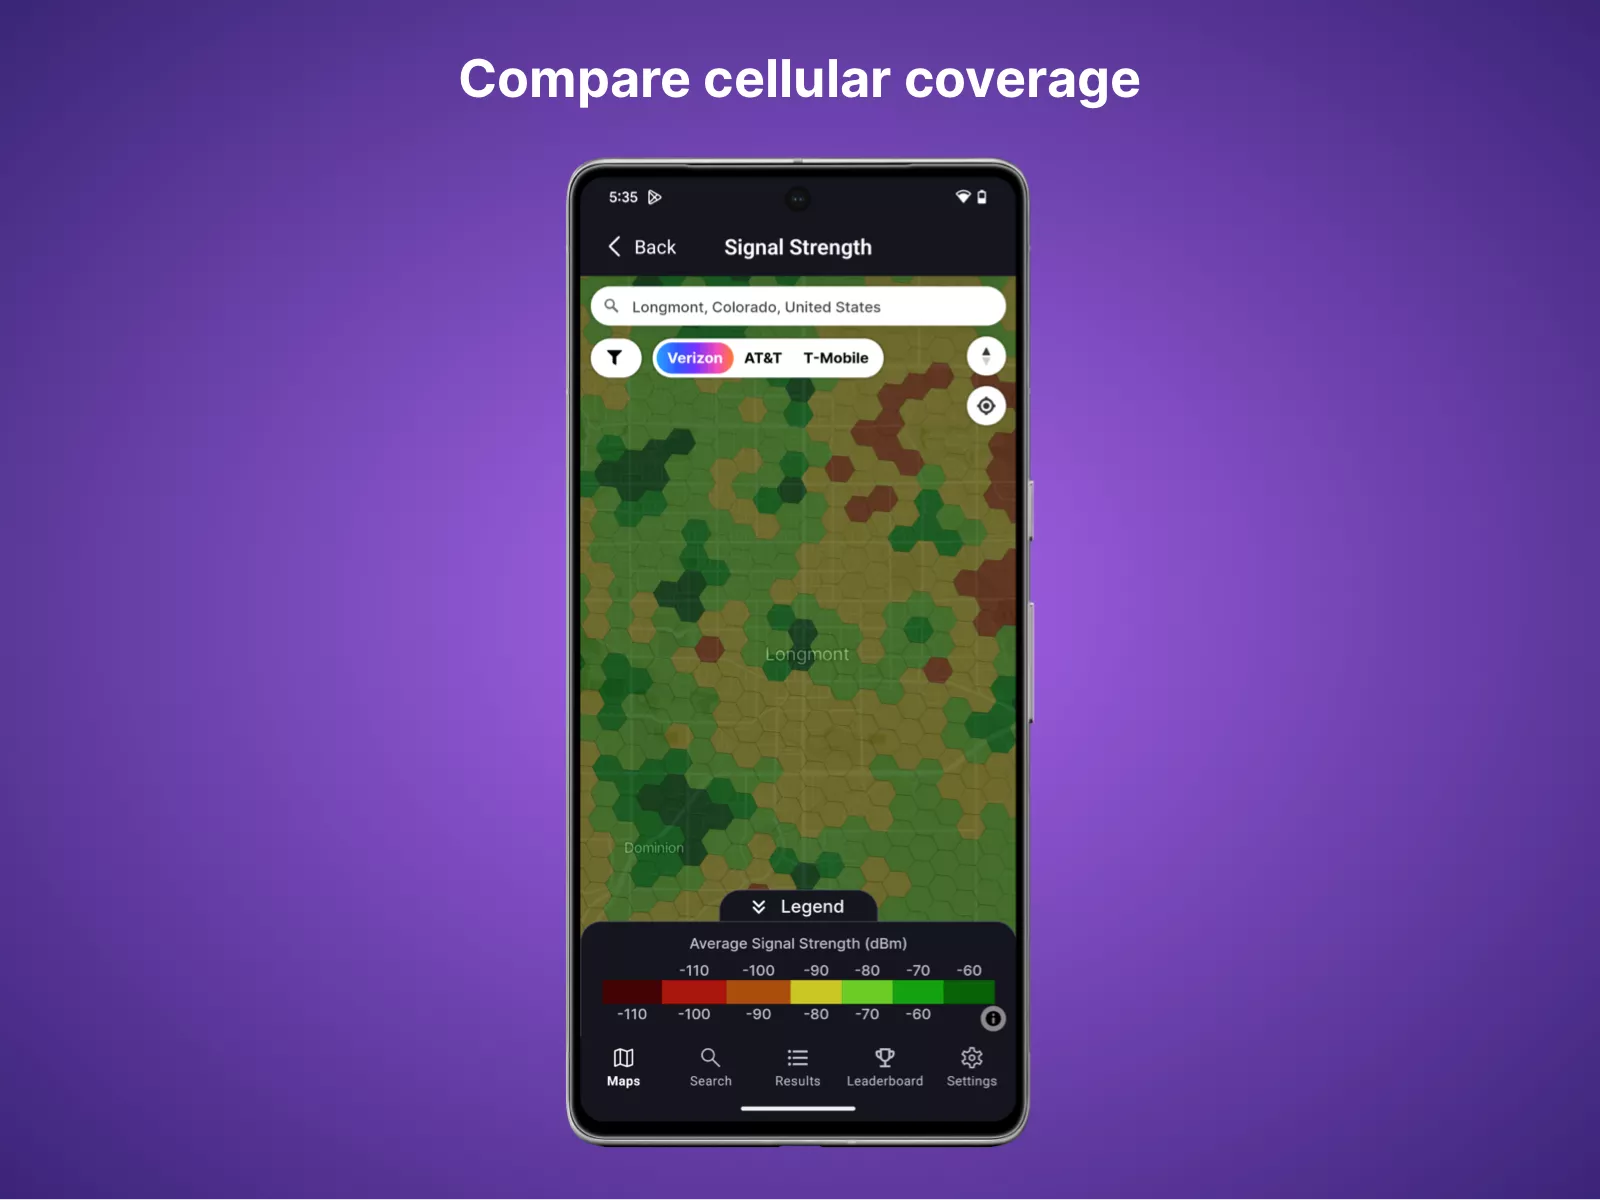
The Signal Strength Map shows where carriers have great, good, or poor reception using FCC data.
Manage & View Your Speed Tests
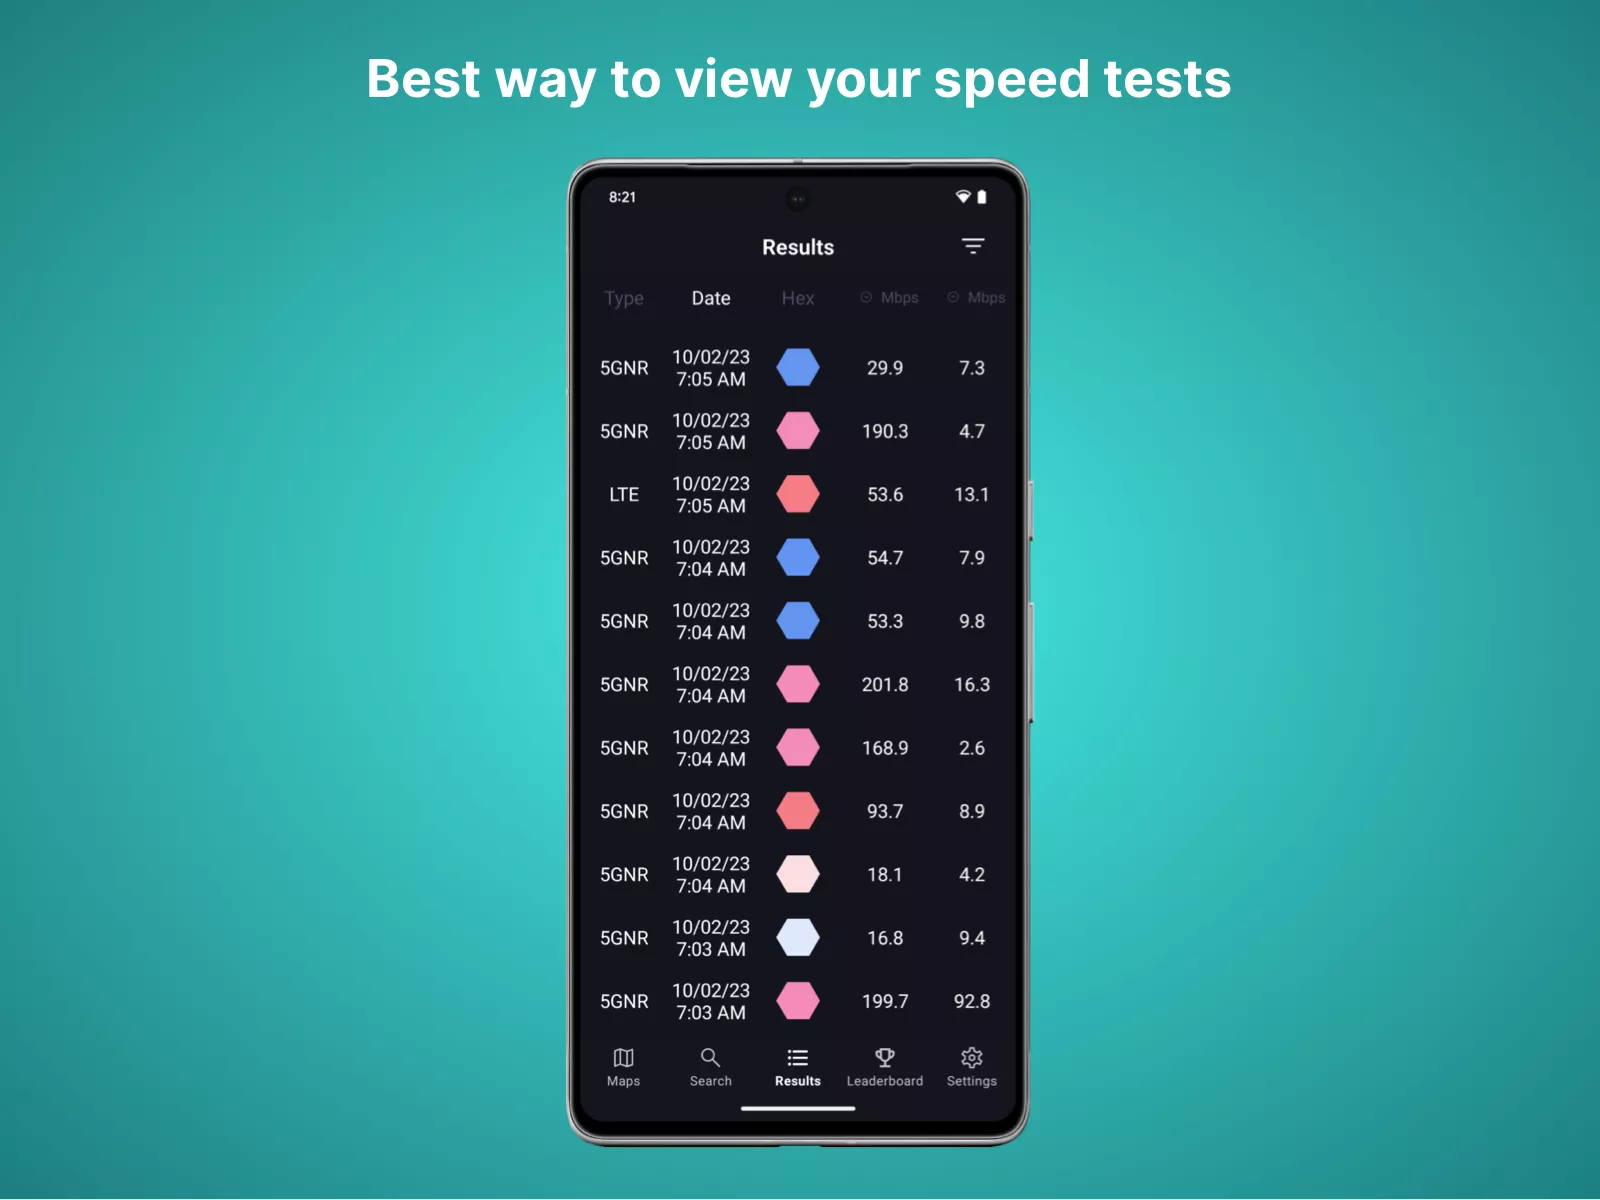
The Results tab shows all speed tests you have uploaded. You can sort results by date, technology, download speed, or upload speed.
Leaderboard
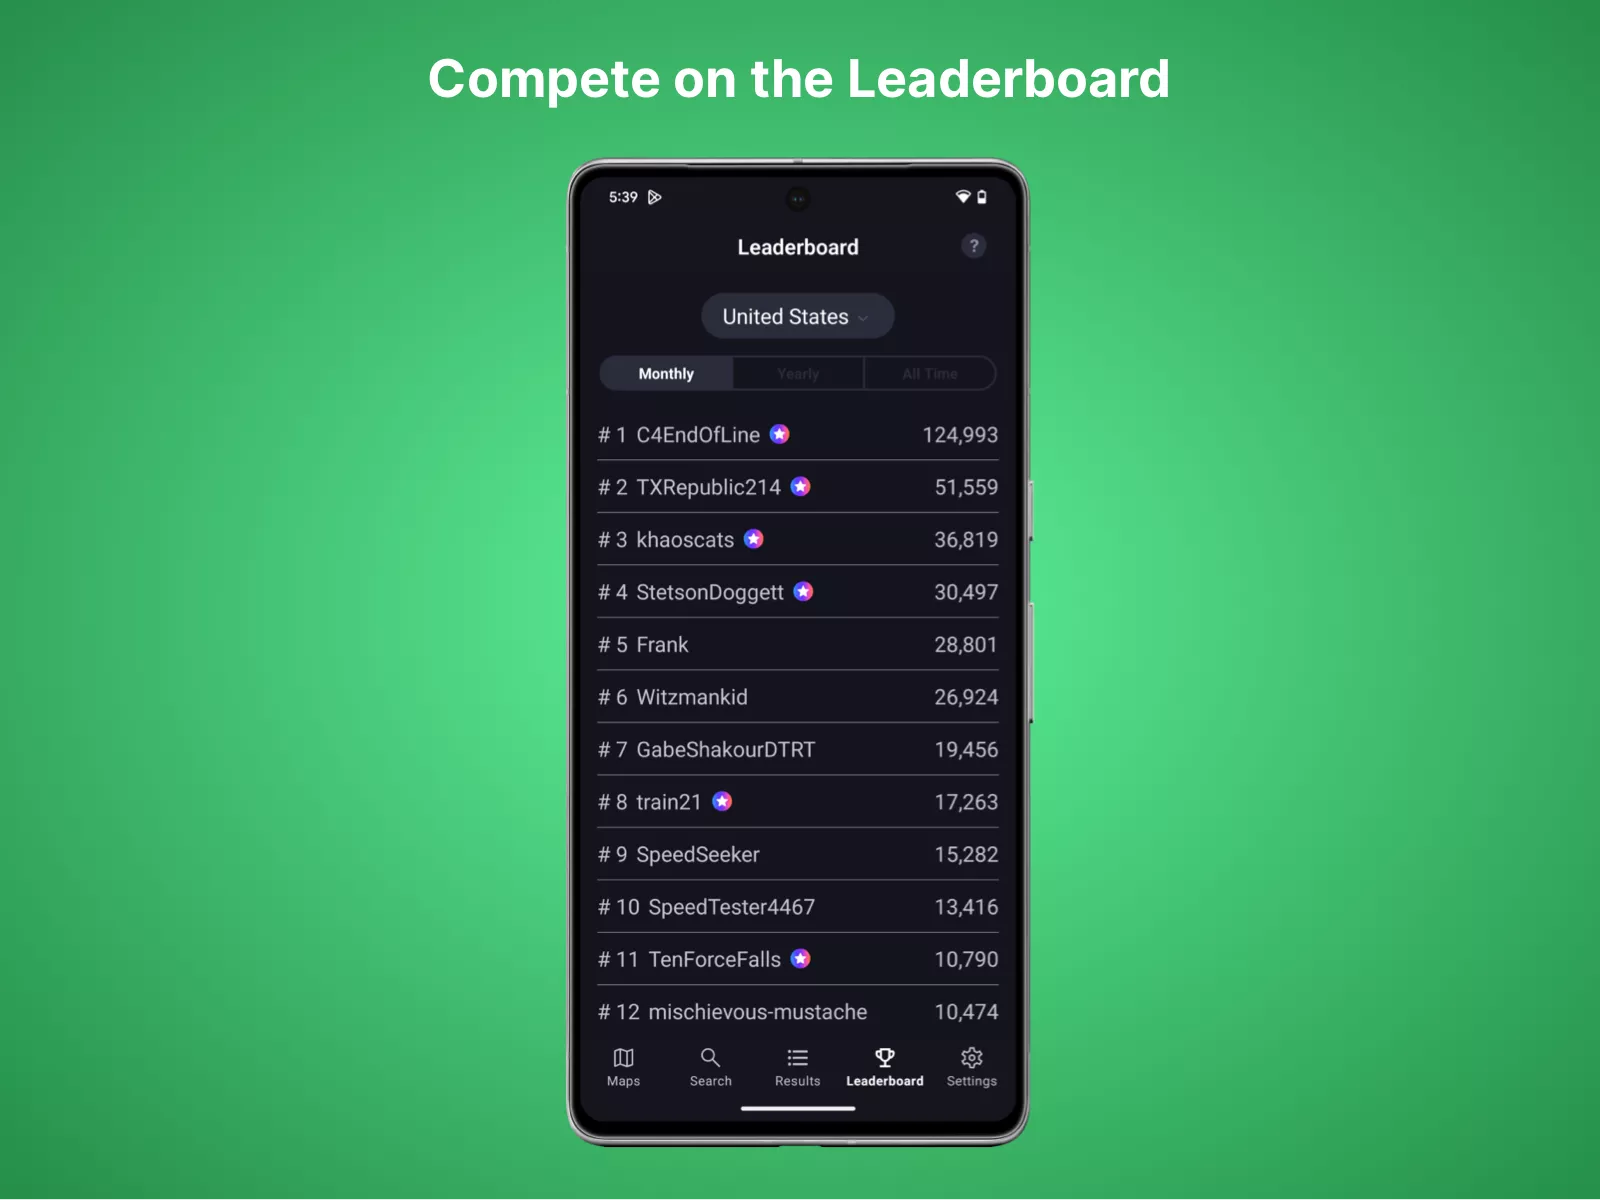
Earn points for every test you upload and for every new hexagon you discover. The leaderboard resets monthly.
- 2 points for every speed test uploaded
- 2 points for every new 25 km hexagon generated
- 2 points for every new 10 km hexagon generated
- 2 points for every new 5 km hexagon generated
- 3 points for every new 2 km hexagon generated
- 5 points for every new 0.7 km hexagon generated
- 10 points for every new 0.3 km hexagon generated
- 15 points for every new 0.1 km hexagon generated
We Think You Are Going to Love It
We built the Coverage Map app for you. It is free to use. Download the Coverage Map app now.